

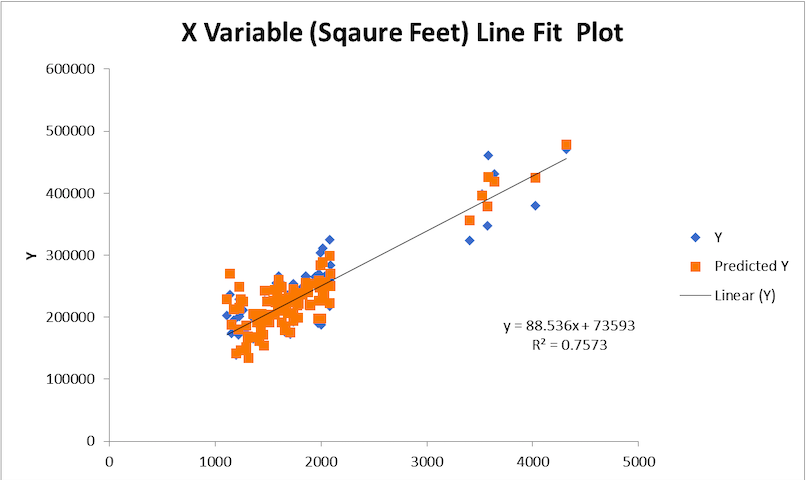
Question: Scatterplot: Provide a graph of the scatterplot of the data with a line of best fit. Explain if a regression model is appropriate to develop
- Scatterplot: Provide a graph of the scatterplot of the data with a line of best fit.
- Explain if a regression model is appropriate to develop based on your scatterplot.
- Discuss associations: Based on the scatterplot, discuss the association (direction, strength, form) in the context of your model.
- Identify any possible outliers or influential points and discuss their effect on the correlation.
- Discuss keeping or removing outlier data points and what impact your decision would have on your model.
- Find r: Find the correlation coefficient (r).
- Explain how the r value you calculated supports what you noticed in your scatterplot.
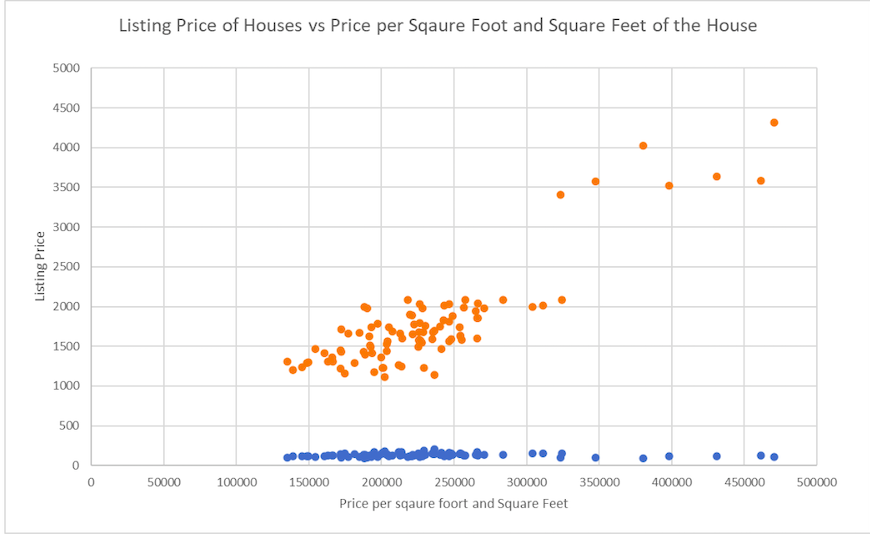
\fListing Price of Houses vs Price per Sqaure Foot and Square Feet of the House 5000 4500 4000 3500 3000 Listing Price 2500 2000 .. . 1500 1000 500 .. S 0 50000 100000 150000 200000 250000 300000 350000 400000 450000 500000 Price per sqaure foort and Square Feet
Step by Step Solution
There are 3 Steps involved in it
1 Expert Approved Answer
Step: 1 Unlock

Question Has Been Solved by an Expert!
Get step-by-step solutions from verified subject matter experts
Step: 2 Unlock
Step: 3 Unlock