

Question: Scatterplot: Select 2 variables from the data set. Draw a scatterplot of the data or rank of the data. Find the line of best fit.
- Scatterplot:
- Select 2 variables from the data set.
- Draw a scatterplot of the data or rank of the data.
- Find the line of best fit.
- Calculate Pearson's or Spearman's R-value.
- Use Excel, Numbers or your GDC.
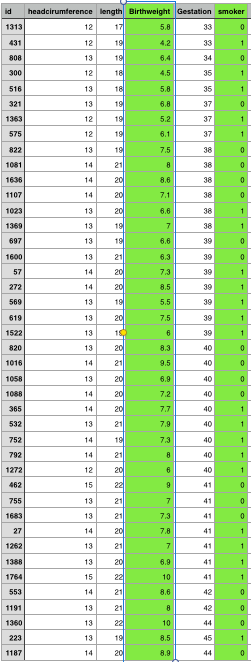
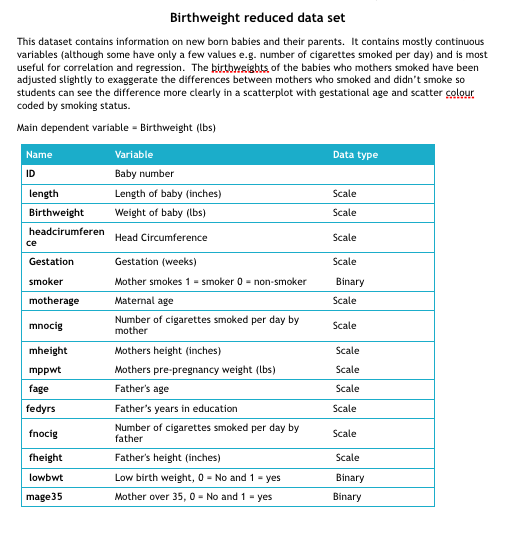
\fBirthweight reduced data set This dataset contains information on new born babies and their parents. It contains mostly continuous variables (although some have only a few values e.g. number of cigarettes smoked per day) and is most useful for correlation and regression. The birthweights of the babies who mothers smoked have been adjusted slightly to exaggerate the differences between mothers who smoked and didn't smoke so students can see the difference more clearly in a scatterplot with gestational age and scatter colour coded by smoking status. Main dependent variable = Birthweight (lbs) Name Variable Data type ID Baby number length Length of baby (inches) Scale Birthweight Weight of baby (lbs) Scale headcirumferen Head Circumference Scale ce Gestation Gestation (weeks) Scale smoker Mother smokes 1 = smoker 0 = non-smoker Binary motherage Maternal age Scale Number of cigarettes smoked per day by mnocig Scale mother mheight Mothers height (inches) Scale mppwt Mothers pre-pregnancy weight (lbs) Scale fage Father's age Scale fedyrs Father's years in education Scale fnocig Number of cigarettes smoked per day by Scale father fheight Father's height (inches) Scale lowbwt Low birth weight, 0 = No and 1 = yes Binary mage35 Mother over 35, 0 = No and 1 = yes Binary
Step by Step Solution
There are 3 Steps involved in it

Get step-by-step solutions from verified subject matter experts