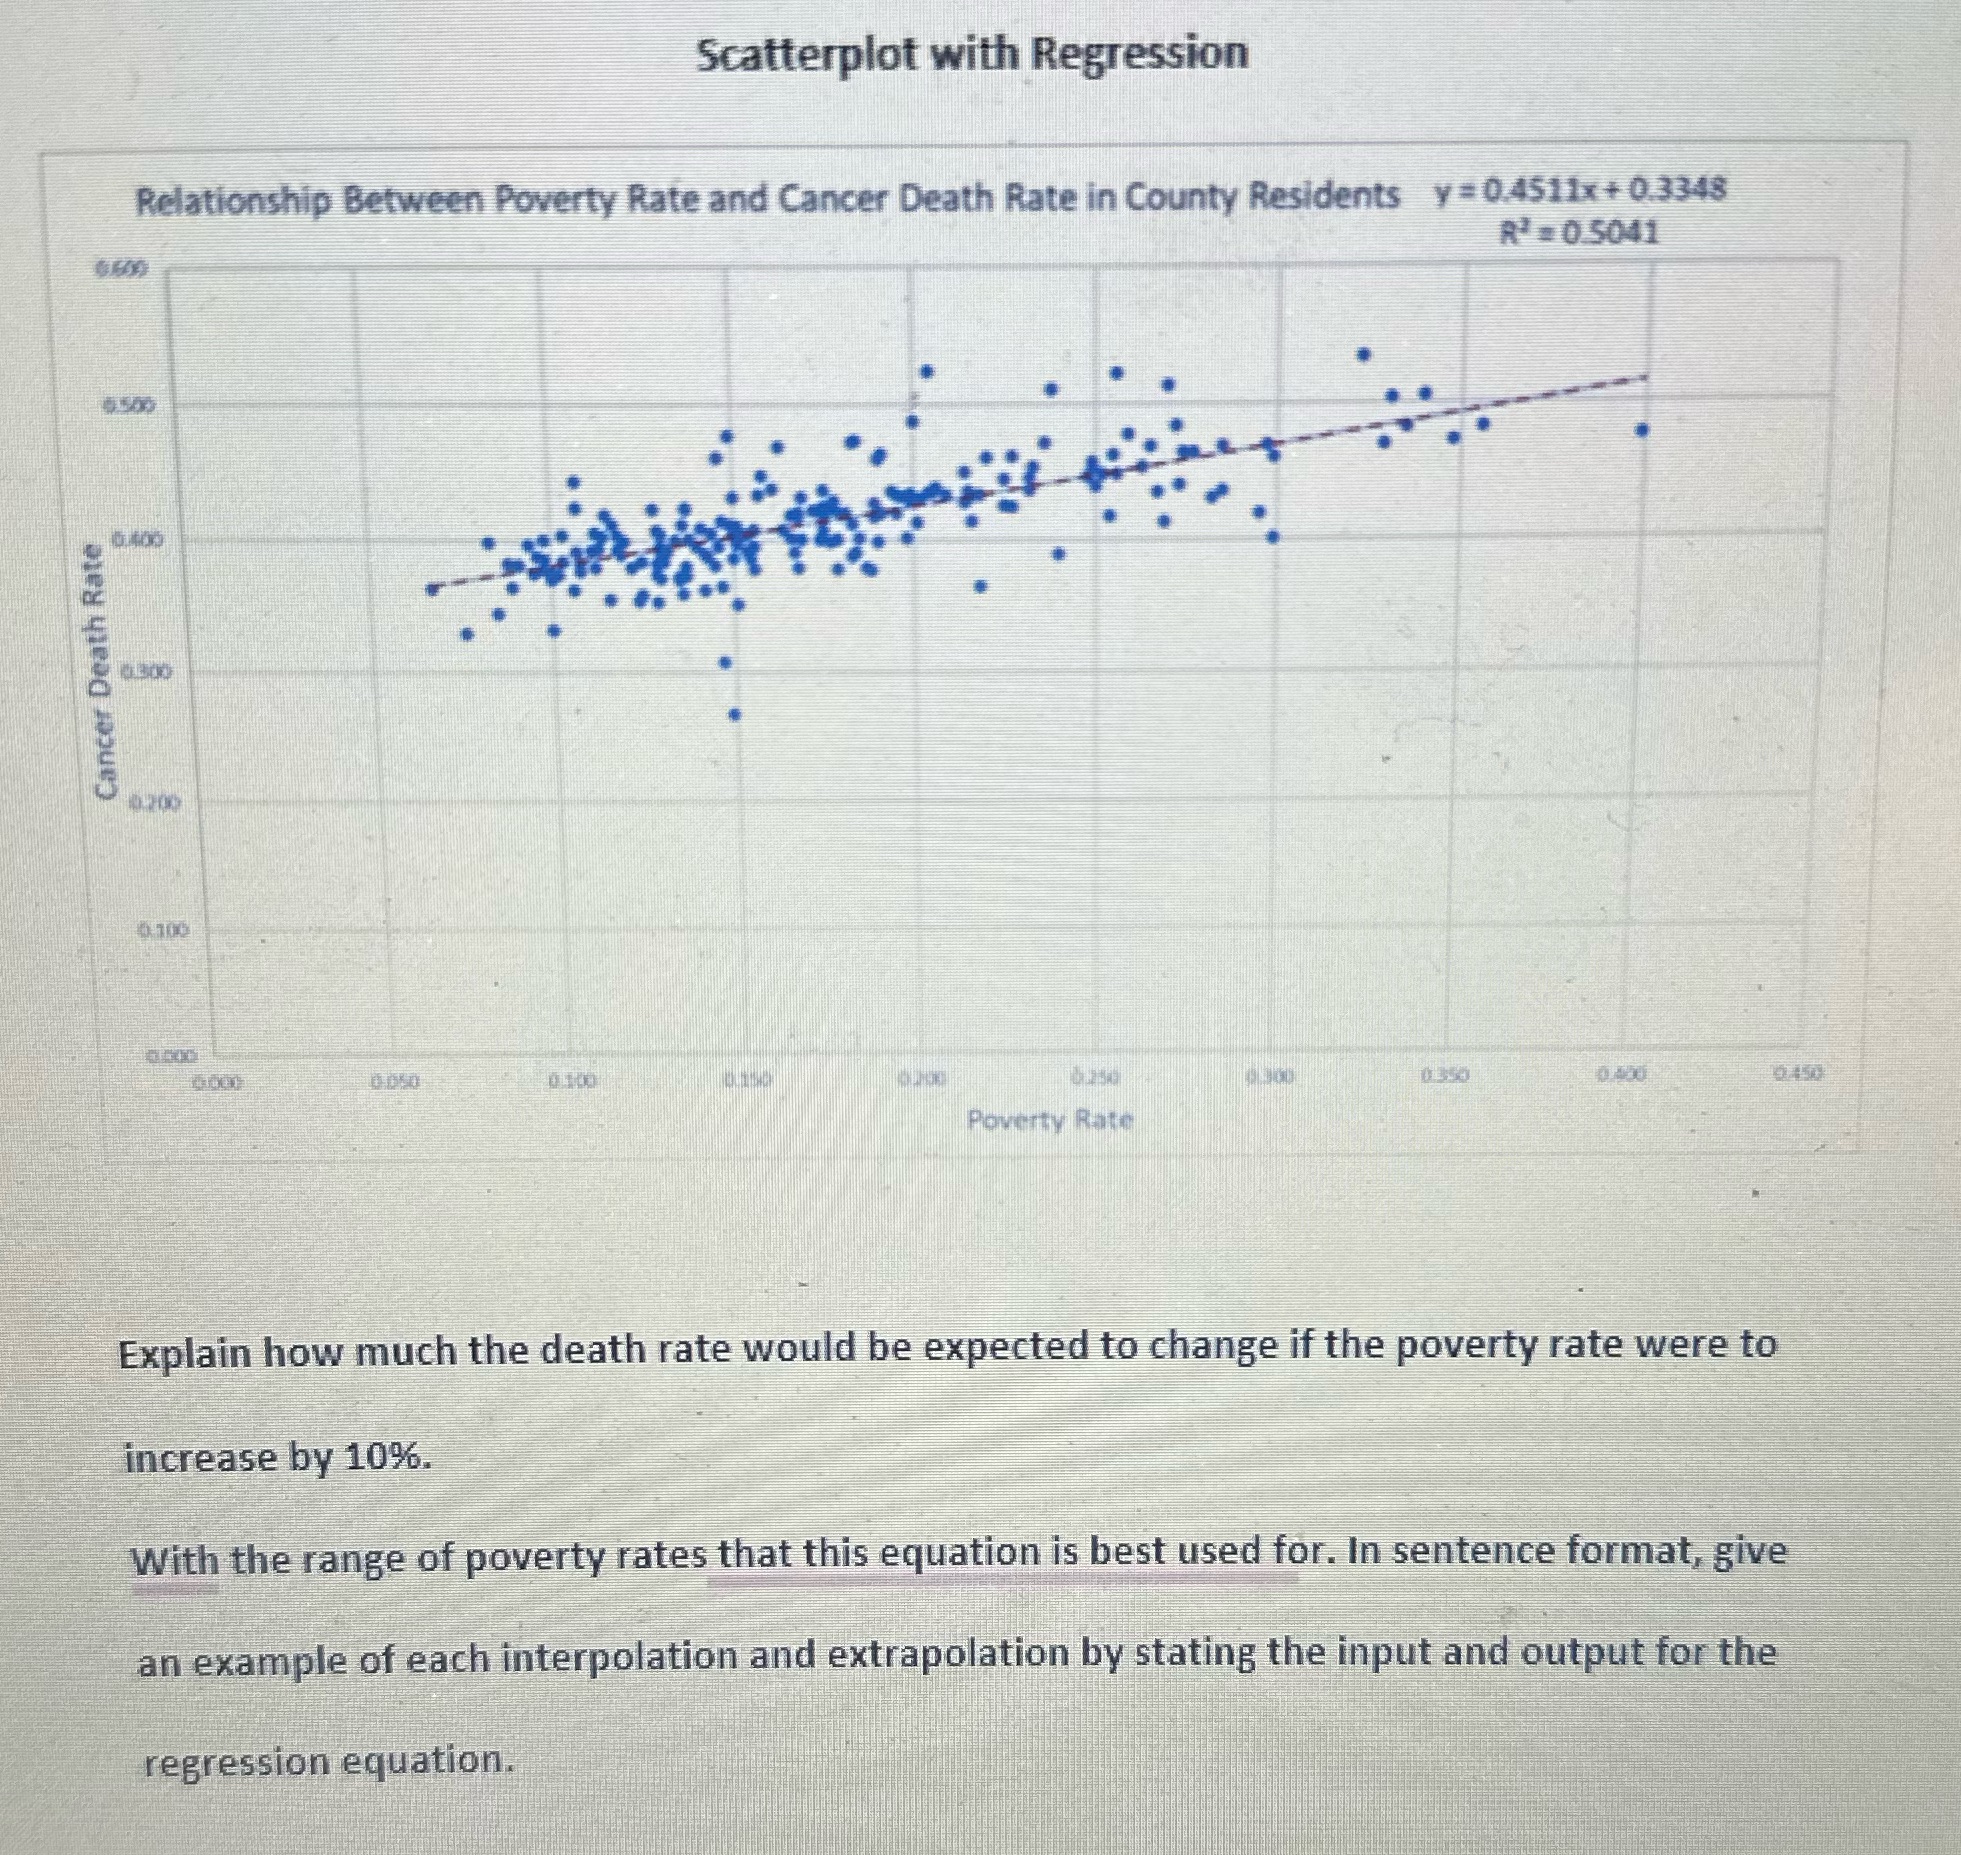
Question: Scatterplot with Regression Relationship Between Poverty Rate and Cancer Death Rate in County Residents y = 0.4511x+ 0.3348 R = 0.5041 Cancer Death Rate 10.203

Scatterplot with Regression Relationship Between
Scatterplot with Regression Relationship Between Poverty Rate and Cancer Death Rate in County Residents y = 0.4511x+ 0.3348 R = 0.5041 Cancer Death Rate 10.203 0 100 6.250 0350 Poverty Rate Explain how much the death rate would be expected to change if the poverty rate were to increase by 10%. With the range of poverty rates that this equation is best used for. In sentence format, give an example of each interpolation and extrapolation by stating the input and output for the regression equation

Step by Step Solution

There are 3 Steps involved in it

1 Expert Approved Answer
Step: 1 Unlock blur-text-image
Question Has Been Solved by an Expert!

Get step-by-step solutions from verified subject matter experts

Step: 2 Unlock
Step: 3 Unlock

Students Have Also Explored These Related Mathematics Questions!