

Question: Scatterplots and Pearson correlation coefficient are good to identify relationship between two numerical features. Below is one such scatter plot. Pearson correlation came out to
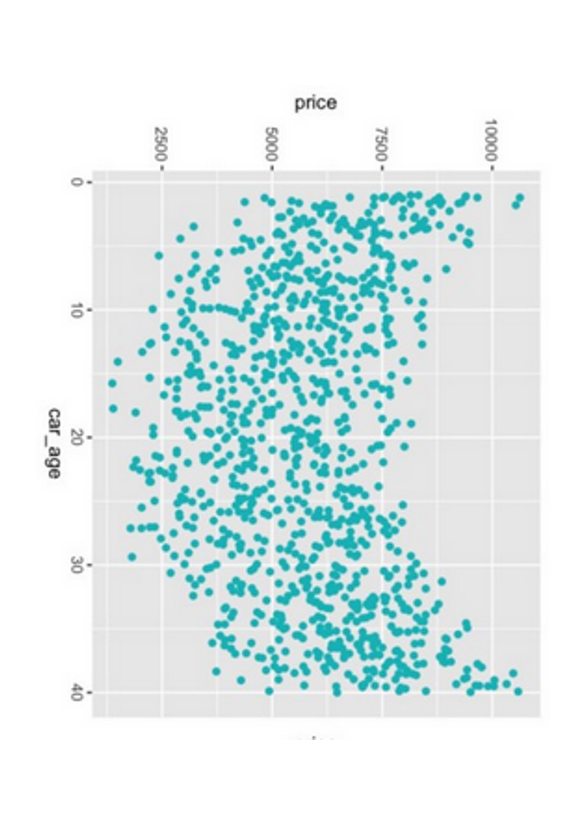
Scatterplots and Pearson correlation coefficient are good to identify relationship between two numerical features. Below is one such scatter plot. Pearson correlation came out to be very low for the data used to plot the graph. Analyst concluded there is no relationship between price and car_age.
Do you find anything wrong with the analysts interpretation? If yes, provide YOUR interpretation for the visual [2M]
What is wrong with Pearson correlation coefficient for this data? [1M]
How to identify and plot this relation-ship in Tableau .Explain[1M]
Step by Step Solution
There are 3 Steps involved in it
1 Expert Approved Answer
Step: 1 Unlock

Question Has Been Solved by an Expert!
Get step-by-step solutions from verified subject matter experts
Step: 2 Unlock
Step: 3 Unlock