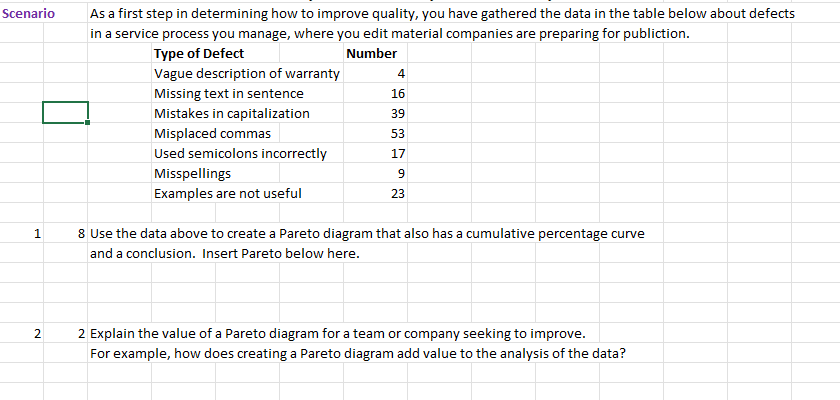
Question: Scenario 16 As a first step in determining how to improve quality, you have gathered the data in the table below about defects in a

Scenario 16 As a first step in determining how to

Scenario 16 As a first step in determining how to improve quality, you have gathered the data in the table below about defects in a service process you manage, where you edit material companies are preparing for publiction. Type of Defect Number Vague description of warranty 4 Missing text in sentence Mistakes in capitalization 39 Misplaced commas Used semicolons incorrectly Misspellings Examples are not useful 53 17 9 23 1 8 Use the data above to create a Pareto diagram that also has a cumulative percentage curve and a conclusion. Insert Pareto below here. N 2 Explain the value of a Pareto diagram for a team or company seeking to improve. For example, how does creating a Pareto diagram add value to the analysis of the data

Step by Step Solution

There are 3 Steps involved in it

1 Expert Approved Answer
Step: 1 Unlock blur-text-image
Question Has Been Solved by an Expert!

Get step-by-step solutions from verified subject matter experts

Step: 2 Unlock
Step: 3 Unlock

Students Have Also Explored These Related General Management Questions!