

Question: Scenario A: In the table below, you are given the following monthly time-series sales data. Month Pd Num Demand Jan-19 1 4394 Feb-19 2
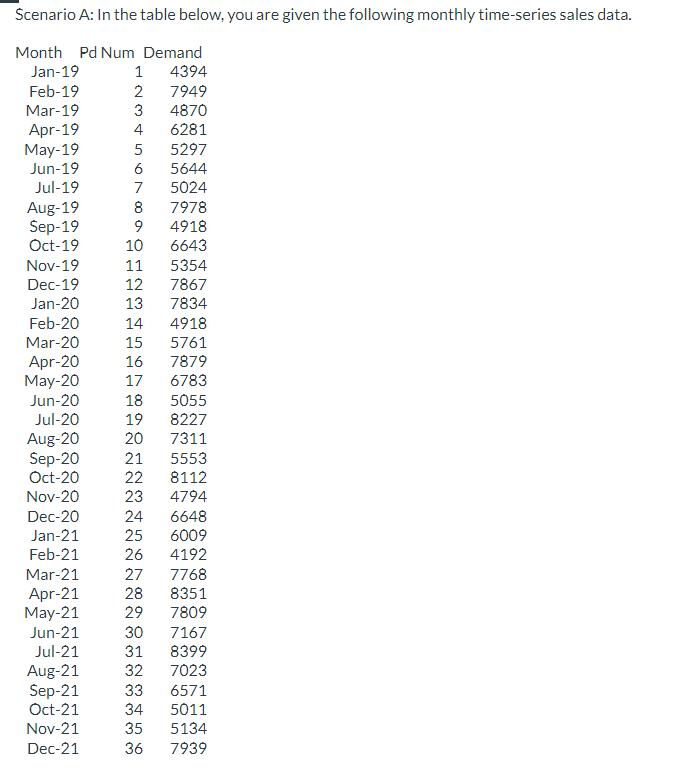


Scenario A: In the table below, you are given the following monthly time-series sales data. Month Pd Num Demand Jan-19 1 4394 Feb-19 2 7949 Mar-19 3 4870 4 6281 5 5297 6 5644 7 5024 Apr-19 May-19 Jun-19 Jul-19 Aug-19 Sep-19 Oct-19 Nov-19 Dec-19 Jan-20 Feb-20 Mar-20 Apr-20 May-20 Jun-20 8 7978 9 4918 10 6643 11 5354 12 7867 13 7834 Nov-20 Dec-20 Jan-21 Feb-21 Mar-21 Apr-21 May-21 Jun-21 Jul-21 Aug-21 Sep-21 Oct-21 Nov-21 Dec-21 14 4918 15 5761 16 7879 17 6783 18 5055 19 8227 20 7311 Jul-20 Aug-20 Sep-20 21 5553 Oct-20 22 8112 23 4794 24 6648 25 6009 26 4192 27 7768 28 8351 29 7809 30 7167 31 8399 32 7023 33 6571 34 5011 35 5134 36 7939 Refer to Scenario A. What is the 3-period simple moving average forecast for January 2022? What is the exponential smoothing forecast for January 2022, using alpha=0? What is the Exponential smoothing forecast for January 2022, using alpha= 1? I
Step by Step Solution
3.43 Rating (153 Votes )
There are 3 Steps involved in it
To calculate the 3period simple moving average forecast for January 2022 take the average of the dem... View full answer

Get step-by-step solutions from verified subject matter experts