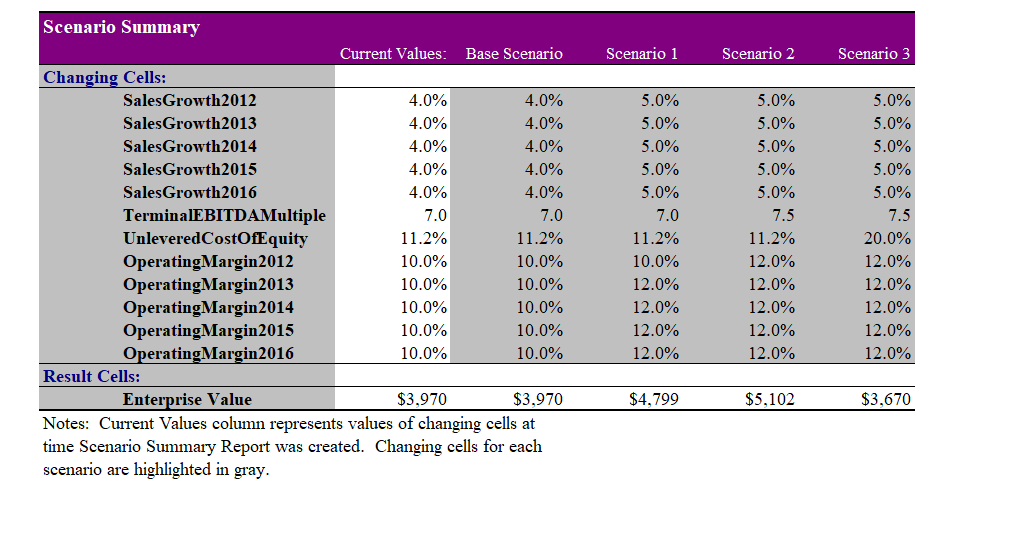
Question: Scenario Summary Current Values: Base Scenario Scenario 1 Scenario 2 Scenario 3 Changing Cells: SalesGrowth2012 4.0% 4.0% 5.0% 5.0% 5.0% SalesGrowth2013 4.0% 4.0% 5.0% 5.0%

Scenario Summary Current Values: Base ScenarioScenario Summary Current Values: Base Scenario
Scenario Summary Current Values: Base Scenario Scenario 1 Scenario 2 Scenario 3 Changing Cells: SalesGrowth2012 4.0% 4.0% 5.0% 5.0% 5.0% SalesGrowth2013 4.0% 4.0% 5.0% 5.0% 5.0% SalesGrowth2014 4.0% 4.0% 5.0% 5.0% 5.0% SalesGrowth2015 4.0% 4.0% 5.0% 5.0% 5.0% SalesGrowth2016 4.0% 4.0% 5.0% 5.0% 5.0% TerminalEBITDAMultiple 7.0 7.0 7.0 7.5 7.5 UnleveredCostOfEquity 11.2% 11.2% 11.2% 11.2% 20.0% OperatingMargin 2012 10.0% 10.0% 10.0% 12.0% 12.0% OperatingMargin2013 10.0% 10.0% 12.0% 12.0% 12.0% OperatingMargin2014 10.0% 10.0% 12.0% 12.0% 12.0% OperatingMargin2015 10.0% 10.0% 12.0% 12.0% 12.0% Operating Margin2016 10.0% 10.0% 12.0% 12.0% 12.0% Result Cells: Enterprise Value $3,970 $3,970 $4,799 $5,102 $3,670 Notes: Current Values column represents values of changing cells at time Scenario Summary Report was created. Changing cells for each scenario are highlighted in gray.Stand-Alone Valuation (dollars in millions) PPG Industries Metric Actual Projected 2011 2012E 2013E Sales Growth (x) 10.9% 4 13 4.32 EBIT Margin (Pretax) 11.2% 1102 12. 02 EVEBITDA 2012 [*) 7.3 DuPont Performance Coatings Metric 2011A Closing Projected 2012E 2013E 2014E 2015E 2016E Sales Growth (x) 12.5% 4.0% 4.0% 4.0% 4.0% 4.0% Depreciation and Amortization $104 $ 115 $118 $122 $125 $130 EBIT Margin (Pretax) 6.3% 10.0% 10.0% 10.0% 10.0% 10.0% Tax Rate' 25% 25% 25% 25% 25% 25% Capital Expenditures $80 $115 $122 $132 $144 $150 Net Working Capital (7) 15.0% 15.0% 15.0% 15.0% 15.0% Terminal EBITDA Multiple (x) = 7.0 Debt/EBITDA 2012 (x) NIA Debt Blended Interest Rate on Debt 6.75% Unlevered Cost of Equity* 11.2% Valuation Analysis: with Zero leverage. 2011A Closing 2012E 2013E 2014E 2015E 2016E Net Sales $4.281 $4.452 $4.630 $4.816 $5,008 $5,208 EBITOA $372 $560 $581 $604 $626 $651 Depreciation and Amortization $104 $ 115 $718 $122 $125 $130 Pretax Operating Income (EBIT) $268 $445 $463 $482 $501 $521 Interest Expense $0 $0 $0 Earnings before Takes $445 $463 $482 $501 $521 Takes $ 1201 $1251 Net Income $334 $347 $36 $376 $391 subtract Increase in Net Working Capital ($26) ($27) $28 ($29 ($30) subtract Capital Expenditures $ 115) ($122) ( $132 ($144) $150 Unlevered Free Cash Flow $308 $317 $323 $327 $341 Terminal Value $4.738 Unlevered FCF, including TV $308 $317 $323 $327 $5,079 Enterprise Value (EV) $3.970 Interest Tax Shield PV Tax Shield EV with Tax Shield $3.970

Step by Step Solution

There are 3 Steps involved in it

1 Expert Approved Answer
Step: 1 Unlock blur-text-image
Question Has Been Solved by an Expert!

Get step-by-step solutions from verified subject matter experts

Step: 2 Unlock
Step: 3 Unlock

Students Have Also Explored These Related Finance Questions!