

Question: Scenario The graph below is provided by a ride sharing service in your area showing the cost, in dollars, of a ride by the mile.
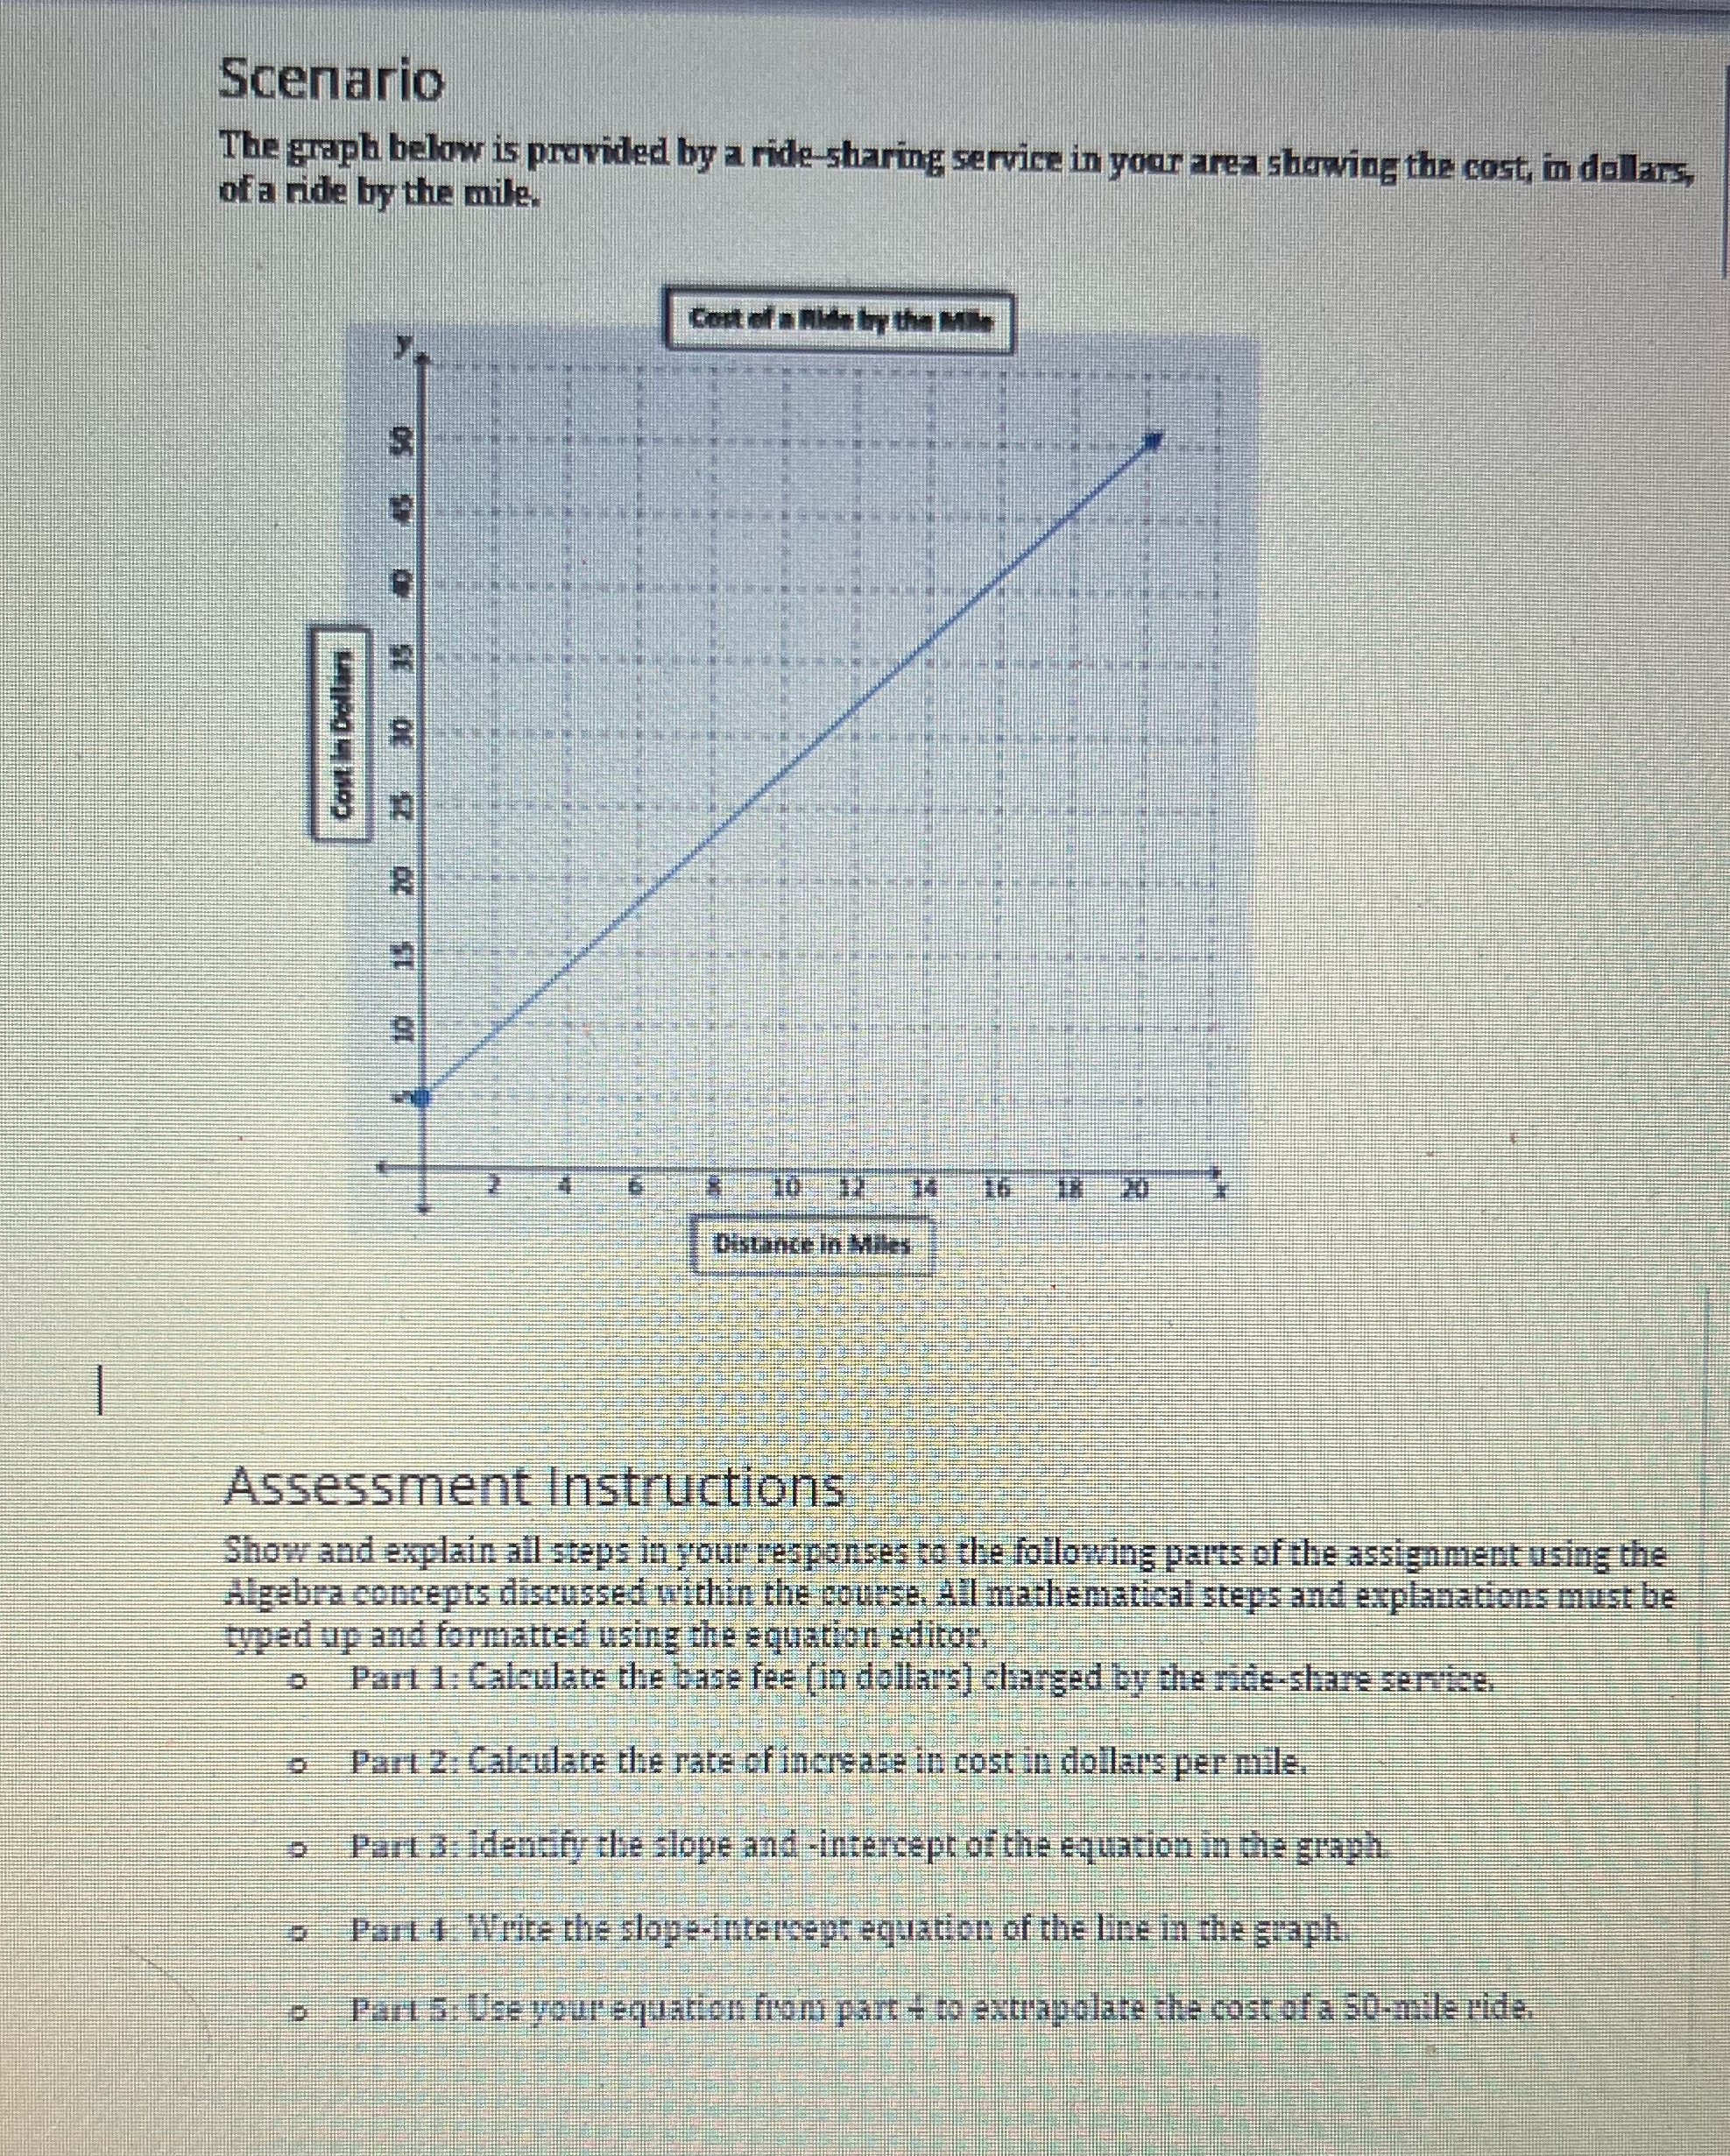
Scenario The graph below is provided by a ride sharing service in your area showing the cost, in dollars, of a ride by the mile. Cost of a Ride by the Mole 35 Cout In Dollars $ 10 1 14 16 18 20 Distance in Miles Assessment Instructions Show and explain all steps in your responses to the following parts of the assignment using the Algebra concepts discussed within the course. All mathematical steps and explanations must be typed up and formatted using the equation editor, Part 1: Calculate the base fee (in dollars] charged by the ride. share service. o Part 2: Calculate the race of increase in cost in dollars per mile o Part 3: Identify the slope and -intercept of the equation in the graph o Part 1 Write the slope-intercept equation of the line in the graph Part 5: Use your equation from part - to extrapolate the cost of a 50-mile ride
Step by Step Solution
There are 3 Steps involved in it

Get step-by-step solutions from verified subject matter experts