

Question: SCHRADER CELLARS ORIGINAL PROBLEM DATA (1 ST Excel File): CHECK FIGURES: Conversion: $5.00 per EU 12/31 Ending Balance WIP $107,500 Schrader Cellars benchmark wines are
 SCHRADER CELLARS
ORIGINAL PROBLEM DATA (1ST Excel File):
CHECK FIGURES: Conversion: $5.00 per EU
12/31 Ending Balance WIP $107,500
Schrader Cellars benchmark wines are made from grapes grown exclusively on one of Napa Valleys most prestigious and historic vineyard estates.
Beckstoffer To Kalon Vineyard, Oakville Originally planted by pioneer Hamilton Crabb in 1868, To Kalon meaning 'highest beauty' in Greek is a noble first growth estate in Oakville that has established itself as the preeminent source of Napa Valleys finest grapes. The vineyard is defined by its high mineral content and exceptional drainage, offering optimal north-south sun exposure by day with cool coastal breezes at night that wine producers feel is the ideal environment for growing Cabernet Sauvignon.
At Schrader Cellars winery, they employ the most naturalistic winemaking practices possible often letting the wines proverbially 'make themselves.' Schrader Cellars believe their low impact, non-interventionist practices produce the most pure, naturally beautiful wines and allow them to bring forward the very best the vintage has to offer.
With all of the attention given to the vines and grapes in the vineyard, the process intensifies at the winery. The Cabernet clusters are removed from the bins and carefully laid out and screened for optimal structure and ripeness, a painstaking hands-on process that often results in berry-by-berry selection.
To begin the winemaking process, the grapes are gently removed from their stems and placed in a stainless steel tank to 'cold soak' where the naturally clear grape juice can pick up both color and character from the grape skins. This process is essential for making lush, densely hued wines and can take up to a week to complete.
Following the cold soak, the temperature of the deep, dark juice and skin mixture is elevated, which activates the natural field yeast present on the grape skins and fermentation begins. The yeast feeds on the sugar in the grape juice to produce alcohol and carbon dioxide gas that is allowed to escape from the top of the tank.
Once fermentation is complete, the wine is separated from the skins and transferred into small French oak barrels for aging.
Below is a video discussing the sorting of the grapes and the beginning of the fermentation process of premium wine making at a Napa Valley winery:
https://www.youtube.com/watch?v=C2IFa36puqM
Schrader Cellars uses the FIFO method in its two department process costing system: Fermenting (grape sorting is part of the fermentation process) and Packaging. Direct materials (grapes) are added at the beginning of the fermenting process and at the end of the packaging process (bottles). Conversion costs are added evenly throughout each process. Data from the month of March for the Fermenting Department are below:
Beginning work in process inventory:
Units in beginning work in process inventory 3,000 gallons
Materials costs $122,000
Conversion costs $7,000
Percentage complete with respect to materials 100%
Percentage complete with respect to conversion 50%
Units started into production during the month 5,000 gallons
Materials costs added during the month $250,000
Conversion costs added during the month $30,000
Ending work in process inventory:
Units in ending work in process 2,000 gallons
Percentage complete with respect to materials 100%
Percentage complete with respect to conversion 75%
REQUIRED:
- Prepare a FIFO production report for the Fermentation Department for Schrader Cellars for the month ended December 31, 2018.
SAVING YOUR FILES:
1. Save the original file according to the following name format:
Original data file: (Your Last Name, First Name Initial) Excel#1.
For Example: SmithJExcel1.xls or SmithJExcel1.xlsx (depending on which version of Microsoft you are using).
2. Save the what if file according to the following name format:
Open the original file and save it under the new following name format:
What If data file: (Your last name, First name initial), Excel IF#1
For Example: SmithJExcelIF1.xls or SmithJExcelIF1.xlsx (depending on which version of Microsoft you are using).
WHAT IF ANALYSIS DATA (2ND Excel File):
CHECK FIGURE: 01/31/19 Total cost transferred out to next dept.: $674,500
The What If part of the assignment will help you determine whether you have correctly used cell referencing in your spreadsheets. In your data block page make the following changes:
- Beginning inventory for WIP, February 1 is 2,000 units; 100% complete as to material costs and 75% complete as to conversion costs. (This is December 31, 2018 ending inventory from the previous report that you just completed which becomes January 31, 2019 beginning inventory in this report.)
- Ending WIP inventory, January 31, 2019 is 3,000 units; 100% complete as to material costs and 20% complete as to conversion costs.
- Units started into production for January are 10,000.
- Carryover the material and conversion costs assigned to the ending WIP 12/31/18 (from the previous report) as the beginning (January 2019) WIP inventory costs.
- Costs added during February are: $510,000 for materials and $40,500 for conversion.
- Change the date in the heading to be For the Month Ended January 31, 2019.
Your spreadsheets should automatically recalculate using the new data. You should not have to change any of the cell references or formulas for either of your statements. (If you dothen you have done the cell referencing incorrectly.) You are only changing the Data Block page.
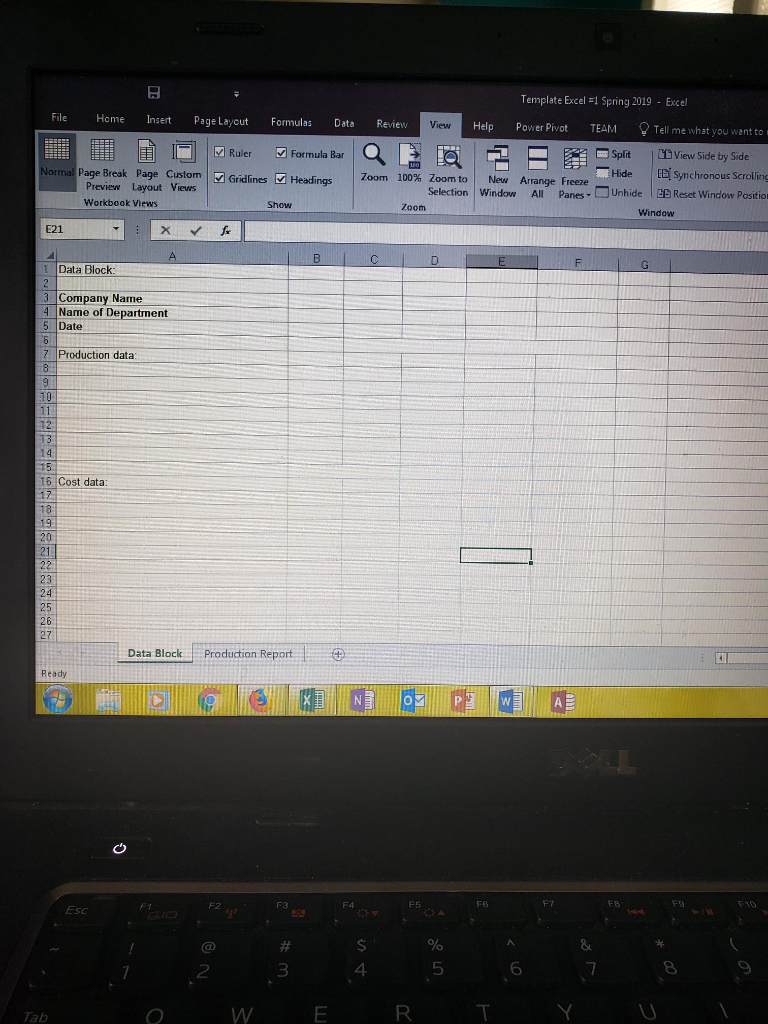
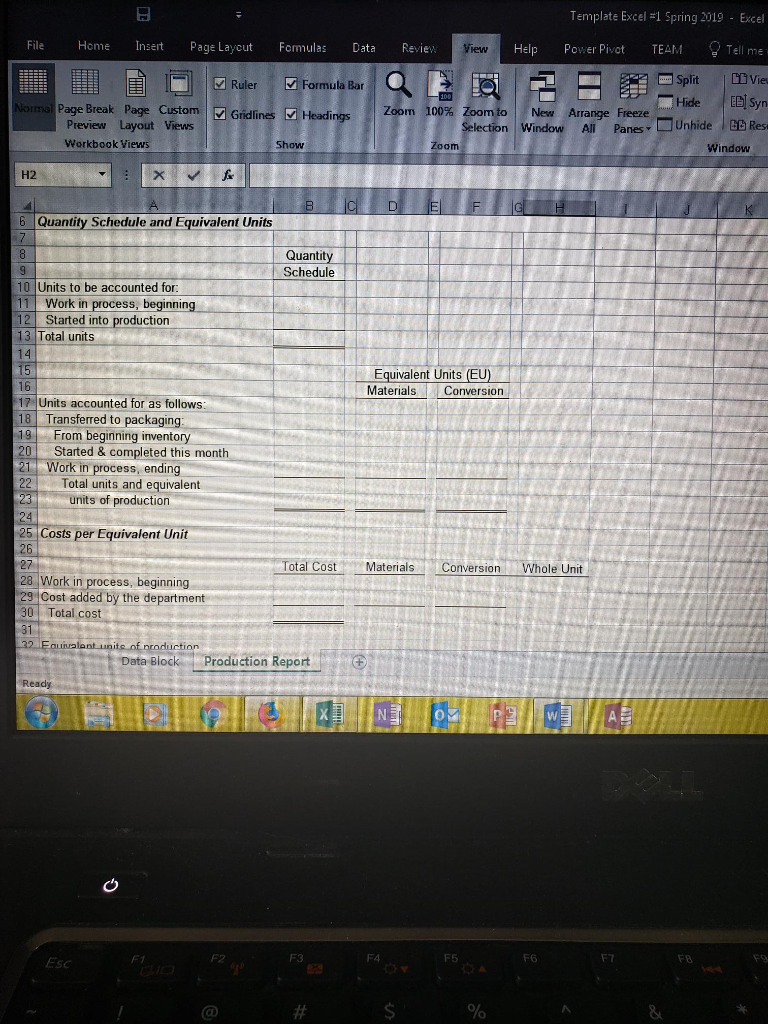
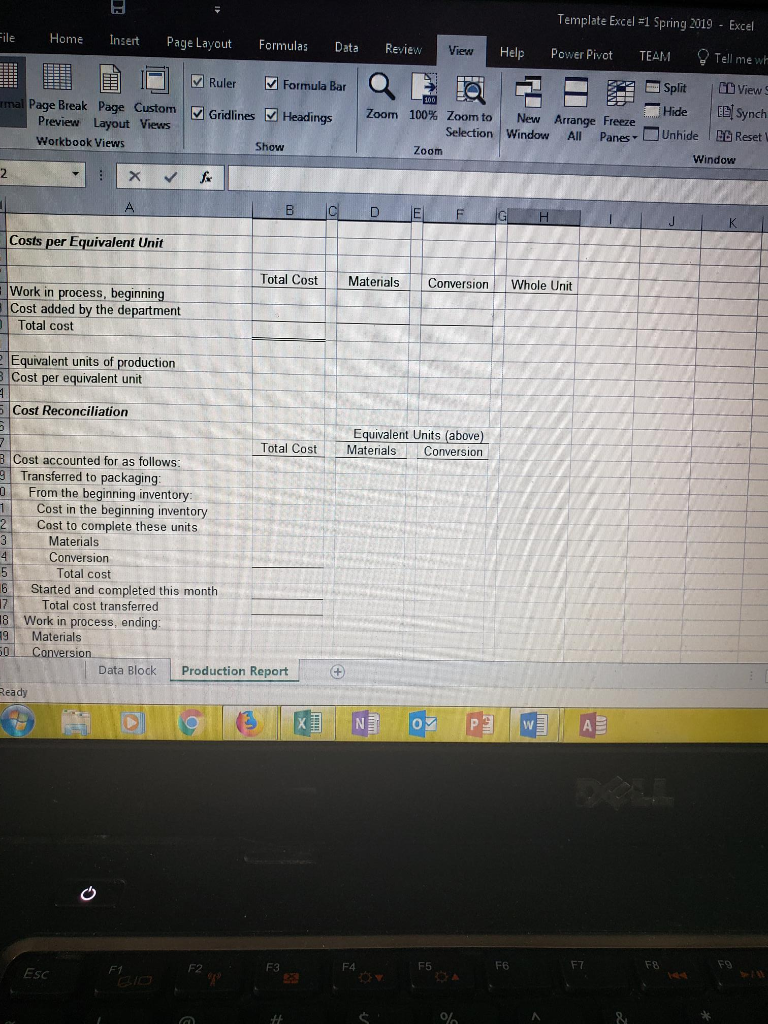
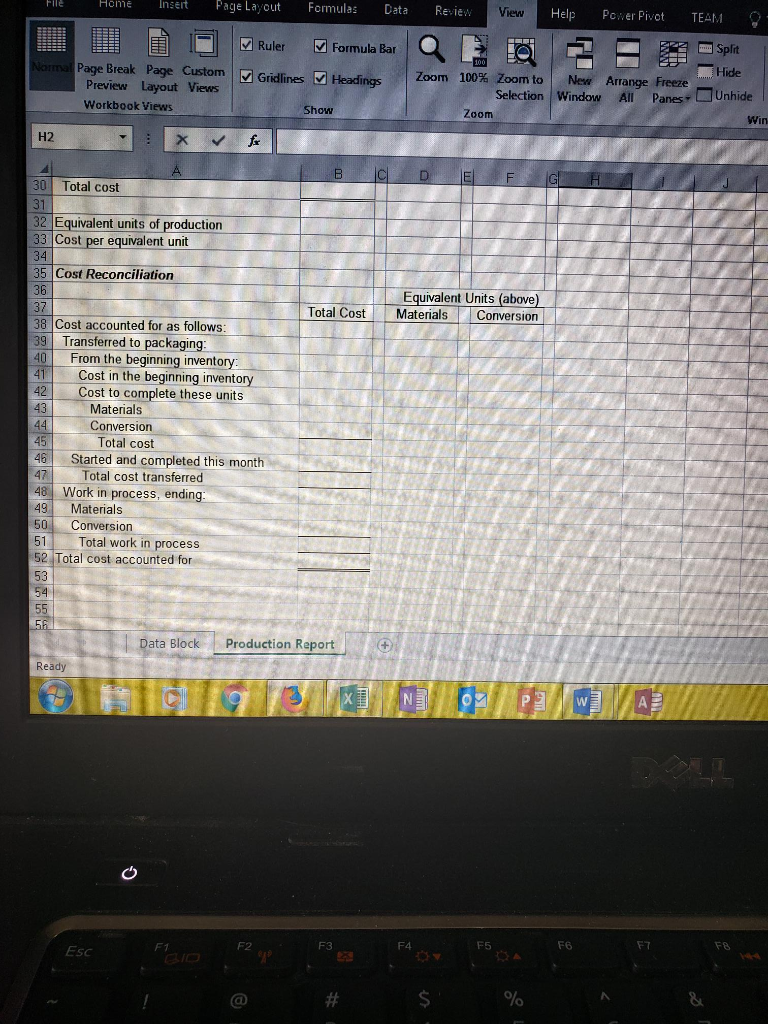
Template Excel l Spring 2019 Excel File Home Insert Page Layout Formulas Data Review View Help Power Pivot TEAMTell me what you want to Split0View Side by Side Hide IE Synchronous Scrolling Ruler Formula Bar Page Break Page Custom| GridlinesHeadings Zoom 100% Zoomto | New Arrange Freeze Selection Window All PaneUnhieE Reset Window Postio Preview Layout Views Workbook vi Zoom Window ews E21 Data Block: 3 Company Name Name of Department 5 Date Production data 14 15 16 Cost data: 20 21 23 24 25 26 27 Data Block Production Report Ready FB F1O FT F4 F5 F2 ESC 4 5 6 2 Tab Template Excel #1 Spring 2019- Excel File Home nert Page Laycut Formulas Data Revie view Help Power Pivot TEAM Tell me Ruler Formula Bar Split IDDViee Hide Page Break Page CustomGridlines Headings Preview Layout Views Workbook Views Zoom 100% Zoom to | New Arrange Freeze n | Window All- Panes, Unhide IBB Res Show Zoom Window H2 Quantity Schedule and Equivalent Units Quantity Schedule 10 Units to be accounted for 1 Work in process, beginning Started into production 13 Total units Equivalent Units (EU) Materials Conversion 16 17,1 Units accounted for as follows: 8 Transferred to packaging: 19 From beginning inventory Started & completed this month 21Work in process, ending 22 Total units and equivalent units of production Costs per Equivalent Unit 26 Total Cost Materials ConversionWhole Unit 28 Work in process, beginning 29 Cost added by the department 30 Total cost - aits nf prnduction Data Bloce Production Report ESC F2 F3 F4 F5 Template Excel Spring 2019-Excel ile Home nert Page Layout Formulas Data Review View Help Power Pivot TEAM Tell me wh Formula Bar a L |Split CDSynch Ruler Page Break Page Custom Gridlines Headings Zoom 100% Zoom to | New Arrange Freeze Selection! window Al' PanesUnhide lBB Reset Preview Layout Views Workbook Views Show Zoom Window Costs per Equivalent Unit Total Cost Materials Conversionwhole Unit . - Work in process, beginning Cost added by the department Total cost Equivalent units of production Cost per equivalent unit Cost Reconciliation Equivalent Units (above) Total otMaterials Conversion 8 Cost accounted for as follows: 9 Transferred to packaging 0From the beginning inventory: 1Cost in the beginning inventory 2Cost to complete these units 3 Materials Conversion Total cost 6Started and completed this month Total cost transferred E-work in process, ending: 9 Materials . onversion Data Block Production Report eady 0 F6 FT F8 F5 F3 Esc Inert Page Layout Formulas Data Review Help Power Pivot TEAM plit Hide Ruler Formula Bar Page Break Page. Custom | Gridlines er Headings Zoom 100% Zoom to | New Arrange Freeze Preview Layout Views Workbook Views Selection Window All PansUnhide Show Zoom Win H2 30 Total cost 32 Equivalent units of production 3 Cost per equivalent unit 34 35 Cost Reconciliation 36 37 38 Cost accounted for as follows 39 Transferred to packaging Equivalent Units (above) Total CostMaterials Conversion From the beginning inventory 4 Cost in the beginning inventory 43 45 4 42 Cost to complete these units Materials Conversion Total cost Started and completed this month Total cost transferred 47 48 Work in process, ending 49 Materials 50 Conversion 51 Total work in process 52 Total cost accounted for 53 ata Block Production Report Ready. F4 F5 F6 F7 F3 ESc Template Excel l Spring 2019 Excel File Home Insert Page Layout Formulas Data Review View Help Power Pivot TEAMTell me what you want to Split0View Side by Side Hide IE Synchronous Scrolling Ruler Formula Bar Page Break Page Custom| GridlinesHeadings Zoom 100% Zoomto | New Arrange Freeze Selection Window All PaneUnhieE Reset Window Postio Preview Layout Views Workbook vi Zoom Window ews E21 Data Block: 3 Company Name Name of Department 5 Date Production data 14 15 16 Cost data: 20 21 23 24 25 26 27 Data Block Production Report Ready FB F1O FT F4 F5 F2 ESC 4 5 6 2 Tab Template Excel #1 Spring 2019- Excel File Home nert Page Laycut Formulas Data Revie view Help Power Pivot TEAM Tell me Ruler Formula Bar Split IDDViee Hide Page Break Page CustomGridlines Headings Preview Layout Views Workbook Views Zoom 100% Zoom to | New Arrange Freeze n | Window All- Panes, Unhide IBB Res Show Zoom Window H2 Quantity Schedule and Equivalent Units Quantity Schedule 10 Units to be accounted for 1 Work in process, beginning Started into production 13 Total units Equivalent Units (EU) Materials Conversion 16 17,1 Units accounted for as follows: 8 Transferred to packaging: 19 From beginning inventory Started & completed this month 21Work in process, ending 22 Total units and equivalent units of production Costs per Equivalent Unit 26 Total Cost Materials ConversionWhole Unit 28 Work in process, beginning 29 Cost added by the department 30 Total cost - aits nf prnduction Data Bloce Production Report ESC F2 F3 F4 F5 Template Excel Spring 2019-Excel ile Home nert Page Layout Formulas Data Review View Help Power Pivot TEAM Tell me wh Formula Bar a L |Split CDSynch Ruler Page Break Page Custom Gridlines Headings Zoom 100% Zoom to | New Arrange Freeze Selection! window Al' PanesUnhide lBB Reset Preview Layout Views Workbook Views Show Zoom Window Costs per Equivalent Unit Total Cost Materials Conversionwhole Unit . - Work in process, beginning Cost added by the department Total cost Equivalent units of production Cost per equivalent unit Cost Reconciliation Equivalent Units (above) Total otMaterials Conversion 8 Cost accounted for as follows: 9 Transferred to packaging 0From the beginning inventory: 1Cost in the beginning inventory 2Cost to complete these units 3 Materials Conversion Total cost 6Started and completed this month Total cost transferred E-work in process, ending: 9 Materials . onversion Data Block Production Report eady 0 F6 FT F8 F5 F3 Esc Inert Page Layout Formulas Data Review Help Power Pivot TEAM plit Hide Ruler Formula Bar Page Break Page. Custom | Gridlines er Headings Zoom 100% Zoom to | New Arrange Freeze Preview Layout Views Workbook Views Selection Window All PansUnhide Show Zoom Win H2 30 Total cost 32 Equivalent units of production 3 Cost per equivalent unit 34 35 Cost Reconciliation 36 37 38 Cost accounted for as follows 39 Transferred to packaging Equivalent Units (above) Total CostMaterials Conversion From the beginning inventory 4 Cost in the beginning inventory 43 45 4 42 Cost to complete these units Materials Conversion Total cost Started and completed this month Total cost transferred 47 48 Work in process, ending 49 Materials 50 Conversion 51 Total work in process 52 Total cost accounted for 53 ata Block Production Report Ready. F4 F5 F6 F7 F3 ESc
Step by Step Solution
There are 3 Steps involved in it

Get step-by-step solutions from verified subject matter experts