

Question: Scilab Please 4. Use M B or Scilab to implement linear regression, and plot the points and the curve for the [01 812 27 andy
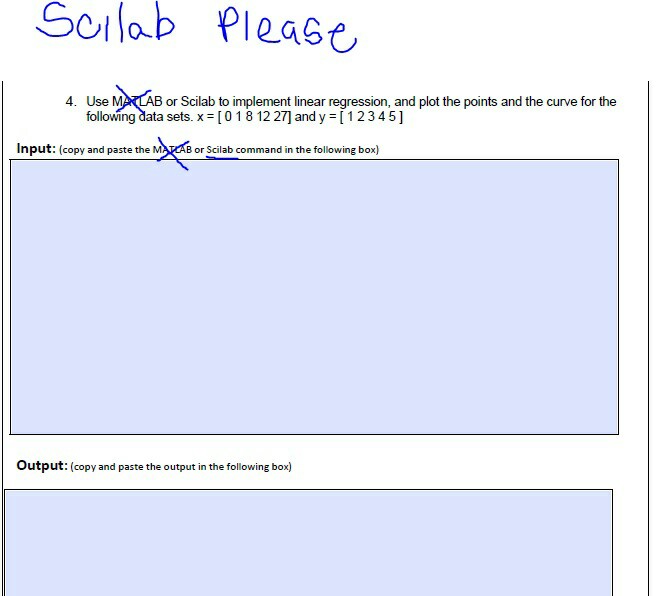
Scilab Please 4. Use M B or Scilab to implement linear regression, and plot the points and the curve for the [01 812 27 andy [1 2 3 4 5 Input: (copy and paste the M B or Scilab command in the following box) output copy and paste the output in the following box)
Step by Step Solution
There are 3 Steps involved in it
1 Expert Approved Answer
Step: 1 Unlock

Question Has Been Solved by an Expert!
Get step-by-step solutions from verified subject matter experts
Step: 2 Unlock
Step: 3 Unlock