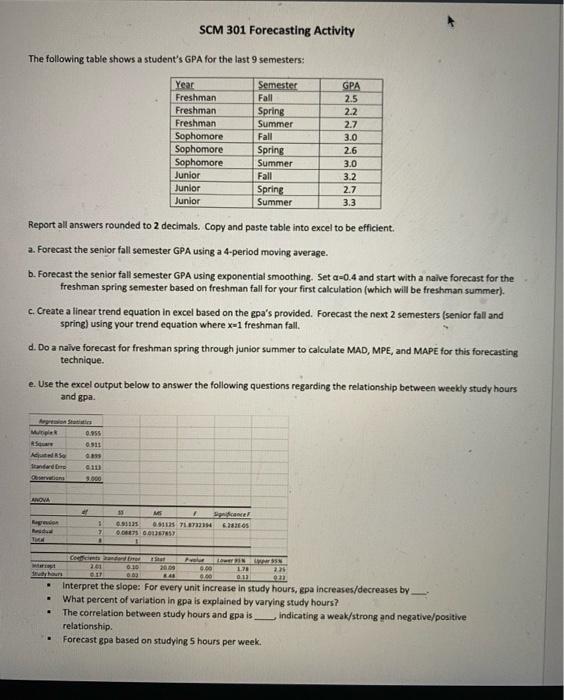
Question: SCM 301 Forecasting Activity The following table shows a student's GPA for the last 9 semesters: Year Freshman Freshman Freshman Sophomore Sophomore Sophomore Junior Junior

SCM 301 Forecasting Activity The following table
SCM 301 Forecasting Activity The following table shows a student's GPA for the last 9 semesters: Year Freshman Freshman Freshman Sophomore Sophomore Sophomore Junior Junior Junior Semester Fall Spring Summer Fall Spring Summer Fall Spring Summer GPA 2.5 2.2 2.7 3.0 2.6 3.0 3.2 2.7 3.3 Report all answers rounded to 2 decimals. Copy and paste table into excel to be efficient. 2. Forecast the senior fall semester GPA using a 4-period moving average. b. Forecast the senior fall semester GPA using exponential smoothing. Set a=0.4 and start with a naive forecast for the freshman spring semester based on freshman fall for your first calculation (which will be freshman summer). c. Create a linear trend equation in excel based on the gpa's provided. Forecast the next 2 semesters (senior fall and spring) using your trend equation where x-1 freshman fall. d. Do a naive forecast for freshman spring through junior summer to calculate MAD, MPE, and MAPE for this forecasting technique. e. Use the excel output below to answer the following questions regarding the relationship between weekly study hours and gpa. 955 0911 AS andard 10 000 ANOVA 15 M Snel 0.53125 1 TIHTIN ES 90671 OOSTA 201 11 6.10 . 2009 84 6. 0.00 178 012 . 2 * Interpret the slope: For every unit increase in study hours, gpa increases/decreases by What percent of variation in gpa is explained by varying study hours? The correlation between study hours and gpa is _indicating a weak/strong and negative/positive relationship Forecast gpa based on studying 5 hours per week. . Question 1 a. MA4 (2 decimals) Question 2 b. Exponential smoothing forecast (2 decimals) D Question 3 part 1 Senior fall 2 decimals] = e Question 4 a part 2 Senior spring (2 decimals) = Question 5 d. MAD- Module 7. SA C Chegg Se.. Untitled d. d. MSE - U Question 7 d. MAPE (as%, rounded to nearest whole such as XX%) - Question 8 e. part 1 For every unit increase in study hours, gpa lincreases or decreases) by D Question 9 e. part 2 What percent of variation in pa is explained by varying study hours? Question 10 part 3 Correlation - Quiz: Module 7 A Module 099 S. Question 9 Home e, part 2 Announcements What percent of variation in spa is explained by varying study hours? Syllabus Discussions Grades People Modules Question 10 Zoom e part 3 Correlation Question 11 e, part 3b correlation is weak and Select . Question 12 e. part 4 forecast sa based on studying 5 hours per week (2 decimais)

Step by Step Solution

There are 3 Steps involved in it

1 Expert Approved Answer
Step: 1 Unlock blur-text-image
Question Has Been Solved by an Expert!

Get step-by-step solutions from verified subject matter experts

Step: 2 Unlock
Step: 3 Unlock

Students Have Also Explored These Related General Management Questions!