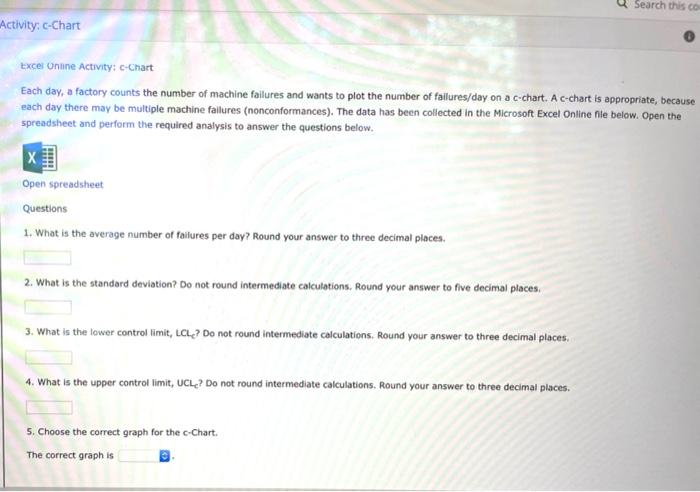
Question: Search this co Activity: c-Chart Excel Online Activity: c-Chart Each day, a factory counts the number of machine failures and wants to plot the number

Search this co Activity: c-Chart Excel Online
Search this co Activity: c-Chart Excel Online Activity: c-Chart Each day, a factory counts the number of machine failures and wants to plot the number of failures/day on a c-chart. A c-chart is appropriate, because each day there may be multiple machine failures (nonconformances). The data has been collected in the Microsoft Excel Online file below. Open the spreadsheet and perform the required analysis to answer the questions below. TO X Open spreadsheet Questions 1. What is the average number of failures per day? Round your answer to three decimal places, 2. What is the standard deviation? Do not round intermediate calculations. Round your answer to five decimal places. 3. What is the lower controllimit, LCLL? Do not round Intermediate calculations. Round your answer to three decimal places. 4. What is the upper controllimit, UCL_? Do not round intermediate calculations, Round your answer to three decimal places. 5. Choose the correct graph for the c-Chart. The correct graph is

Step by Step Solution

There are 3 Steps involved in it

1 Expert Approved Answer
Step: 1 Unlock blur-text-image
Question Has Been Solved by an Expert!

Get step-by-step solutions from verified subject matter experts

Step: 2 Unlock
Step: 3 Unlock

Students Have Also Explored These Related General Management Questions!