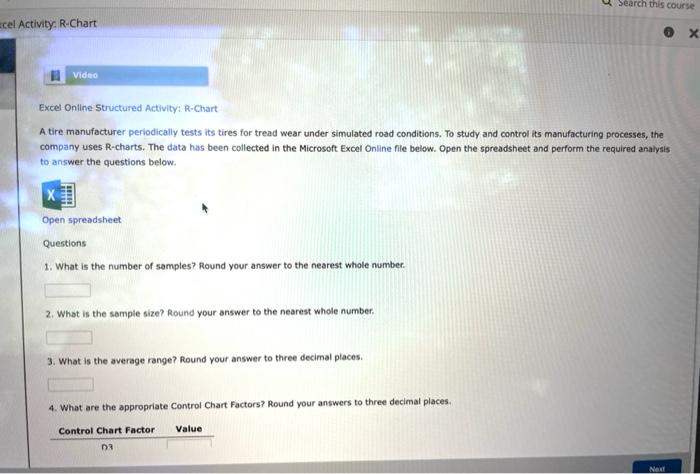
Question: Search this course cel Activity: R.Chart Video Excel Online Structured Activity: R-Chart A tire manufacturer periodically tests its tires for tread wear under simulated road

Search this course cel Activity: R.Chart Video
Search this course cel Activity: R.Chart Video Excel Online Structured Activity: R-Chart A tire manufacturer periodically tests its tires for tread wear under simulated road conditions. To study and control its manufacturing processes, the company uses R-charts. The data has been collected in the Microsoft Excel Online file below. Open the spreadsheet and perform the required analysis to answer the questions below. X Open spreadsheet Questions 1. What is the number of samples? Round your answer to the nearest whole number. 2. What is the sample size? Round your answer to the nearest whole number, 3. What is the average range? Round your answer to three decimal places. 4. What are the appropriate Control Chart Factors? Round your answers to three decimal places. Value Control Chart Factor D Next Activity: 5. What is the lower controllimit for the R-chart? Round your answer to three decimal places. 6. What is the value that specifies the center line for the R-chart? Round your answer to three decimal places. 7. What is the upper controllimit for the R-chart? Round your answer to three decimal places. 8. Choose the correct graph for the chart. The correct graph is R-Chart Barcer 45 40 35 Ranges Lower controllimit Cane Upper Controllimit 30 25 20 Net Back File Home Insert Draw Page Layout Arial v 10 B 12 fx A B C D E F G H DATA 1 2 3 4 5 6 7 8 UNAN 2 3 4 5 6 7 8 9 10 11 12 13 14 15 16 17 18 19 20 21 22 23 24 25 26 27 28 29 30 31 No on 10 11 12 13 14 15 16 17 18 1 37 35 16 20 29 37 17 35 33 39 47 50 43 23 47 49 50 19 19 34 27 48 25 41 20 46 30 2 36 33 26 23 27 28 50 35 34 21 44 38 25 32 36 32 49 20 35 29 21 44 38 48 48 22 22 3 41 26 43 25 19 40 38 46 38 49 32 39 41 17 38 17 44 36 17 38 36 48 38 49 32 48 45 4 20 36 24 34 31 49 22 29 48 18 32 29 36 25 32 35 37 23 46 31 27 46 48 37 36 17 46 5 39 21 43 17 18 26 45 36 46 28 39 47 41 29 19 25 50 18 40 47 49 16 41 34 41 33 32 19 20 21 22 23 24 25 26 27 Aria 10 B B General M 1 G H 1 5 F - 23 45 31 27 46 NA NA ANA NOSSANEXO 18 19 20 21 22 23 24 25 26 27 28 29 30 B 19 19 34 27 48 25 45 20 46 30 16 25 24 F 20 35 29 21 44 38 48 48 22 22 10 18 17 36 17 30 36 46 38 49 32 45 45 28 24 47 F 18 40 47 49 16 41 34 40 33 32 30 26 49 N NA NA NA NA INA NA NA NONS 99.5%B8&$ 0 NA INA INA NA RA INA ANA ANA INA NA - 0 1 2 TANIA NA NA ANA ANA 37 36 17 46 18 22 40 NA NA ANA NA NA ANA INA NI NA NA NA WNA UNA NEBES NA ANA NA F NA FANA FONA 14 NA NA NA Number of sales Spesie NA INA NA Average Range Control ChanFactors (see cel A36) NA INA D4 56 Control Chart Factors 37 A2 D3 04 d2 AS 33 134 35 2 1.880 0.000 3.267 1.128 2650 0.000 3.207 39 3 1.023 0.000 2.574 1693 1954 0.000 2.568 -10 4 0.729 0.000 2.282 2.050 1.628 0.000 2266 1 5 0.577 0.000 2.114 2.326 1.427 0000 2000 6 0.483 0.000 2004 2.634 1.267 0.050 1970 7 0.419 0.076 1.624 2.704 1.162 0 1181082 44 8 0373 0.135 1.854 2.847 1.099 0.185 1815 45 9 0.337 0.154 1.816 2970 1,032 0.230 1761 10 0.308 0.223 1.777 3.078 0.975 0.264 1716 47 1 Use the area below to constructa line chart representing a R.chart 49 so 51

Step by Step Solution

There are 3 Steps involved in it

1 Expert Approved Answer
Step: 1 Unlock blur-text-image
Question Has Been Solved by an Expert!

Get step-by-step solutions from verified subject matter experts

Step: 2 Unlock
Step: 3 Unlock

Students Have Also Explored These Related General Management Questions!