Question: Search this course loring Operations Activity: Economic Order Quantity Model and the Effect of Capital Costs Economic Order Quantity (EOQ) Conceptual Overview: Explore components that
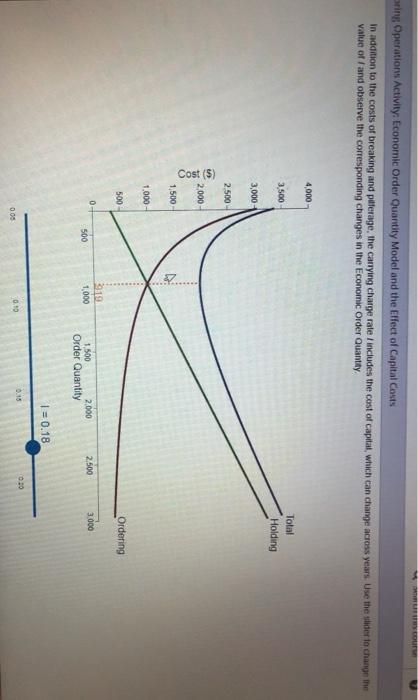
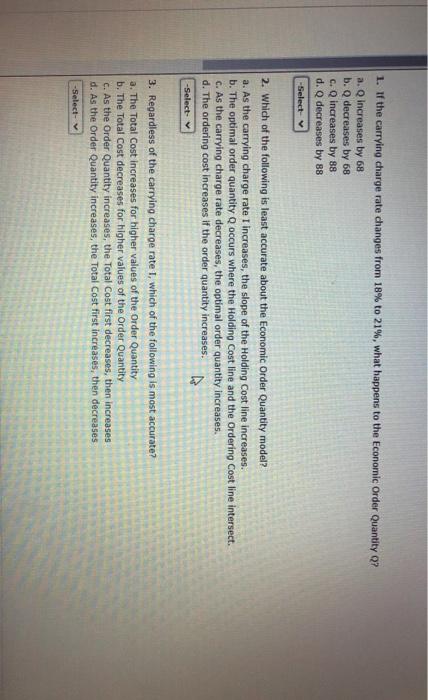
Search this course loring Operations Activity: Economic Order Quantity Model and the Effect of Capital Costs Economic Order Quantity (EOQ) Conceptual Overview: Explore components that determine the minimum-cost economic order quantity, EOQ. Keeping a lot of goods in Inventory is expensive but ordering frequently with foxed costs for each order is also expensive. The Economic Order Quantity Model determines the optimal balance between number of orders and goods held in inventory. The cost to hold an item inventory is the product of the cost of the item times the annual carrying charge rate / expressed as a fraction of the item cost. The holding cost MC when c$12.00 item and I 016 is given by HC = $CI = $(12.0000.18 = 1.080 where equals the number of items in each order The holding cost HC is the green line labeled "Holding increasing with in the graph below The ordering cost OC is the number of orders per year times (total demand D divided by the size of each order ) times the fixed cost of making each order. Thus, the ordering cost oC when D = 24,000 cases and Co - $38.00 is given by OCE 24.000 38 912,000 The ordering cost OC is the red line labeled "Ordering" decreasing with in the graph below. The total cost TC is simply the sum of the holding and ordering costs and is represented by the blue line labeled "Total" that dips and then increases in the graph below The Economic Ordering Quantity is the value of which minimizes the total cost TC and which necessarily, equalizes the holding and ordering costs When the graph loads the optimum value of Q = 919 cases In addition to the costs of breaking and pilferage, the carrying charge rate includes the cost of capital, which can change across years Use the sider to change the value of/ and observe the corresponding changes in the Economic Order Quantity oring Operations Activity, Economic Order Quantity Model and the Effect of Capital Costs In addition to the costs of breaking and puterage, the carrying charge rate/includes the cost of capital, which can change across years. Use the slider to change the value of and observe the corresponding changes in the Economic Order Quantity 4,000 3.500 Total Holding 3,000 2.500 Cost (5) 2,000 1,500 1.000 500 Ordering 0 219 1,000 500 2.500 3.000 1,500 2.000 Order Quantity 1 = 0.18 00 00 010 1. If the carrying charge rate changes from 18% to 21%, what happens to the Economic Order Quantity Q? a. Q increases by 68 b. Q decreases by 68 c. Q increases by 88 d. Q decreases by 88 -Select- 2. Which of the following is least accurate about the Economic Order Quantity model? a. As the carrying charge rate I increases, the slope of the Holding Cost line increases. b. The optimal order quantity occurs where the Holding Cost line and the Ordering Cost line intersect. C. As the carrying charge rate decreases, the optimal order quantity increases. d. The ordering cost increases if the order quantity increases. -Select- 3. Regardless of the carrying charoe rate 1, which of the following is most accurate? a. The Total Cost increases for higher values of the Order Quantity b. The Total cost decreases for higher values of the Order Quantity c. As the Order Quantity increases, the Total Cost first decreases, then increases d. As the Order Quantity increases, the Total Cost first increases, then decreases -Select


