

Question: sears target Wal-Mart I need the mean, standard deviation and correlation coefficient between volatility and each independent variable. (I'm looking for only 2017) Fiscal year
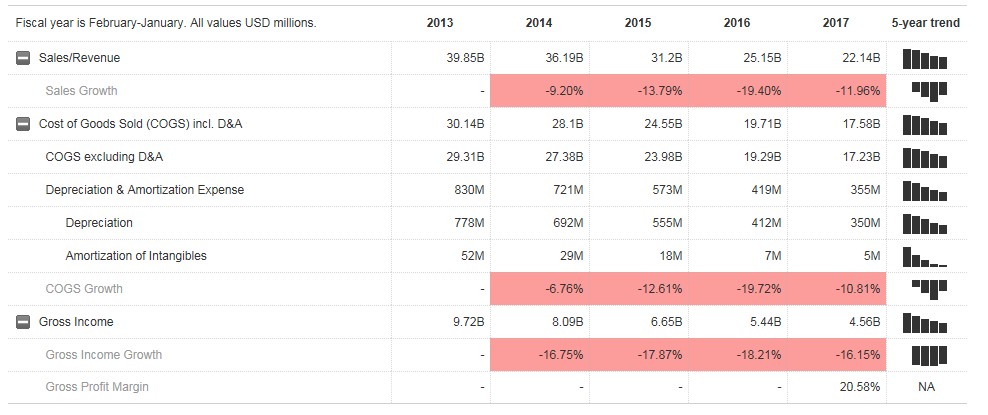
sears

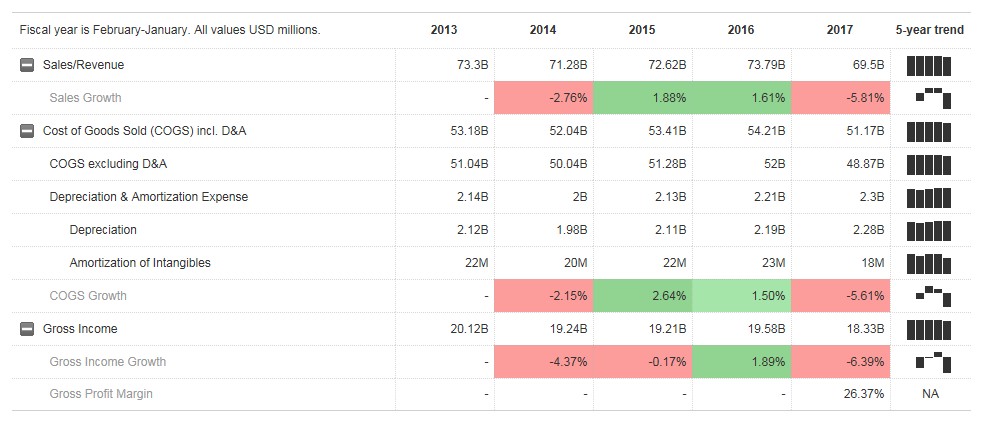
target
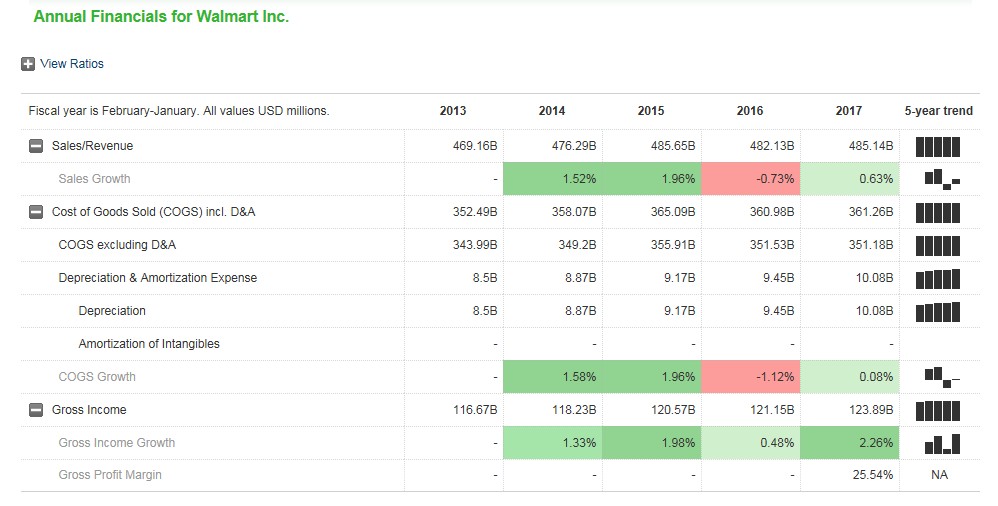
Wal-Mart
I need the mean, standard deviation and correlation coefficient between volatility and each independent variable. (I'm looking for only 2017)
Fiscal year is February-January. All values USD millions 2013 2014 2015 2016 2017 5-year trend Sales/Revenue 39.85B 36.19B -9.20% 28.1B 27.38B 721M 692M 29M 31.2B -13.79% 24.55B 23.98B 573M 555M 25.15B 22.14B Sales Growth -19.40% -11.96% 111 Cost of Goods Sold (COGS) incl. D&A 30.14B 19.71B COGS excluding D&A 29.31B 19.29B 355M Depreciation & Amortization Expense 830M 419M Depreciation 778M 412M 350M 18M 7M -19.72% 5.44B Amortization of Intangibles 52M COGS Growth -6.76% -12.61% -10.81% Gross Income 9.72B 8.09B 6.65B 4.56B -16.75% -17.87% -18.21% -16.15% 11 Gross Income Growth Gross Profit Margin 20.58% NA Fiscal year is February-January. All values USD millions 2013 2014 2015 2016 2017 5-year trend Sales/Revenue 39.85B 36.19B -9.20% 28.1B 27.38B 721M 692M 29M 31.2B -13.79% 24.55B 23.98B 573M 555M 25.15B 22.14B Sales Growth -19.40% -11.96% 111 Cost of Goods Sold (COGS) incl. D&A 30.14B 19.71B COGS excluding D&A 29.31B 19.29B 355M Depreciation & Amortization Expense 830M 419M Depreciation 778M 412M 350M 18M 7M -19.72% 5.44B Amortization of Intangibles 52M COGS Growth -6.76% -12.61% -10.81% Gross Income 9.72B 8.09B 6.65B 4.56B -16.75% -17.87% -18.21% -16.15% 11 Gross Income Growth Gross Profit Margin 20.58% NA
Step by Step Solution
There are 3 Steps involved in it

Get step-by-step solutions from verified subject matter experts