

Question: SECTION 1 - Background Data 1. Google the 2019 10K for PepsiCo. 2. Locate the Table of Contents in the 10K. The Table of Contents
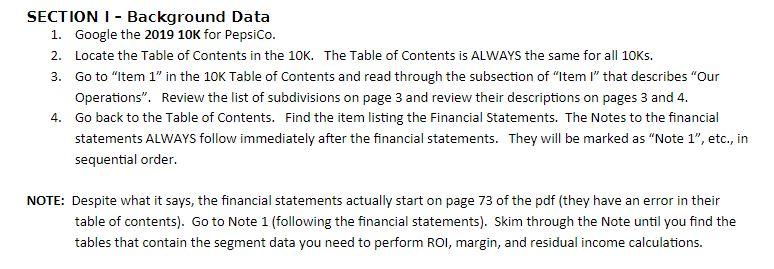
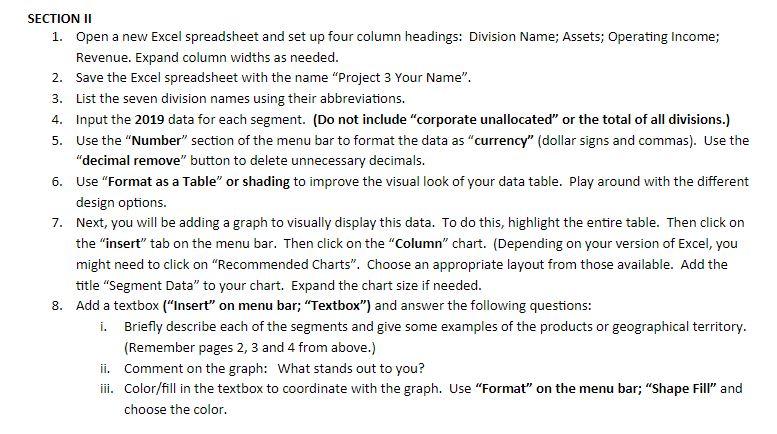
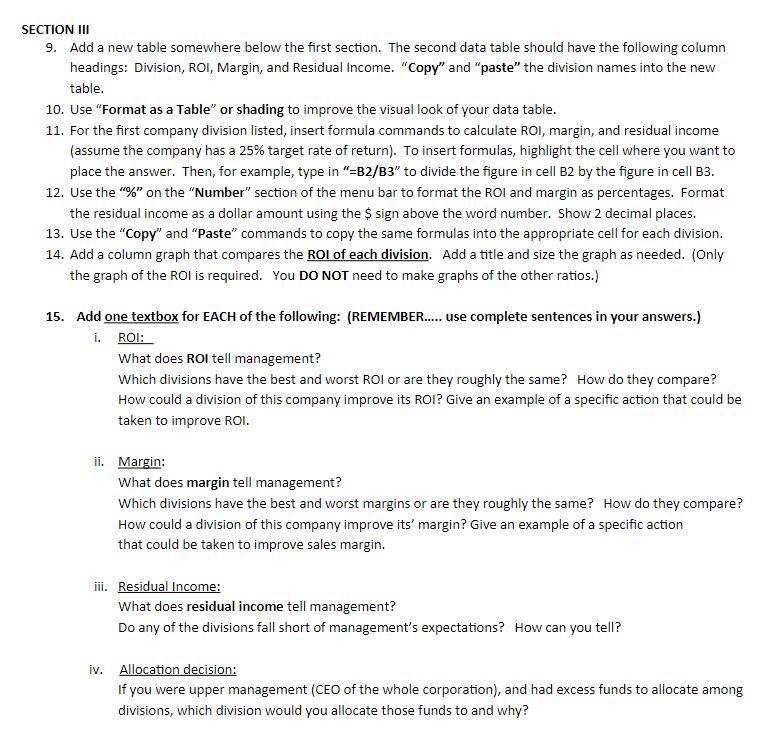
SECTION 1 - Background Data 1. Google the 2019 10K for PepsiCo. 2. Locate the Table of Contents in the 10K. The Table of Contents is ALWAYS the same for all 10Ks. 3. Go to "Item 1" in the 10K Table of Contents and read through the subsection of "Iteml" that describes "Our Operations. Review the list of subdivisions on page 3 and review their descriptions on pages 3 and 4. 4. Go back to the Table of Contents. Find the item listing the Financial Statements. The Notes to the financial statements ALWAYS follow immediately after the financial statements. They will be marked as "Note 1", etc., in sequential order. NOTE: Despite what it says, the financial statements actually start on page 73 of the pdf (they have an error in their table of contents). Go to Note 1 (following the financial statements). Skim through the Note until you find the tables that contain the segment data you need to perform ROI, margin, and residual income calculations. SECTION II 1. Open a new Excel spreadsheet and set up four column headings: Division Name; Assets; Operating Income; Revenue. Expand column widths as needed. 2. Save the Excel spreadsheet with the name "Project 3 Your Name". 3. List the seven division names using their abbreviations. 4. Input the 2019 data for each segment. (Do not include "corporate unallocated or the total of all divisions.) 5. Use the "Number" section of the menu bar to format the data as "currency" (dollar signs and commas). Use the "decimal remove" button to delete unnecessary decimals. 6. Use "Format as a Table" or shading to improve the visual look of your data table. Play around with the different design options. 7. Next, you will be adding a graph to visually display this data. To do this, highlight the entire table. Then click on the "insert" tab on the menu bar. Then click on the "Column" chart. (Depending on your version of Excel, you might need to click on "Recommended Charts". Choose an appropriate layout from those available. Add the title "Segment Data" to your chart. Expand the chart size if needed. 8. Add a textbox ("Insert" on menu bar; "Textbox") and answer the following questions: i. Briefly describe each of the segments and give some examples of the products or geographical territory. (Remember pages 2, 3 and 4 from above.) ii. Comment on the graph: What stands out to you? iii. Color/fill in the textbox to coordinate with the graph. Use "Format" on the menu bar; "Shape Fill" and choose the color. SECTION INI 9. Add a new table somewhere below the first section. The second data table should have the following column headings: Division, ROI, Margin, and Residual Income. "Copy" and "paste" the division names into the new table. 10. Use "Format as a Table or shading to improve the visual look of your data table. 11. For the first company division listed, insert formula commands to calculate ROI, margin, and residual income (assume the company has a 25% target rate of return). To insert formulas, highlight the cell where you want to place the answer. Then, for example, type in "=B2/B3" to divide the figure in cell B2 by the figure in cell B3. 12. Use the "%" on the "Number" section of the menu bar to format the ROI and margin as percentages. Format the residual income as a dollar amount using the $ sign above the word number. Show 2 decimal places. 13. Use the "Copy" and "Paste" commands to copy the same formulas into the appropriate cell for each division. 14. Add a column graph that compares the ROI of each division. Add a title and size the graph as needed. (Only the graph of the ROI is required. You DO NOT need to make graphs of the other ratios.) 15. Add one textbox for EACH of the following: (REMEMBER..... use complete sentences in your answers.) i. ROI: What does ROI tell management? Which divisions have the best and worst ROI or are they roughly the same? How do they compare? How could a division of this company improve its ROI? Give an example of a specific action that could be taken to improve ROI. ii. Margin: What does margin tell management? Which divisions have the best and worst margins or are they roughly the same? How do they compare? How could a division of this company improve its' margin? Give an example of a specific action that could be taken to improve sales margin. iii. Residual Income: What does residual income tell management? Do any of the divisions fall short of management's expectations? How can you tell? iv. Allocation decision: If you were upper management (CEO of the whole corporation), and had excess funds to allocate among divisions, which division would you allocate those funds to and why? SECTION 1 - Background Data 1. Google the 2019 10K for PepsiCo. 2. Locate the Table of Contents in the 10K. The Table of Contents is ALWAYS the same for all 10Ks. 3. Go to "Item 1" in the 10K Table of Contents and read through the subsection of "Iteml" that describes "Our Operations. Review the list of subdivisions on page 3 and review their descriptions on pages 3 and 4. 4. Go back to the Table of Contents. Find the item listing the Financial Statements. The Notes to the financial statements ALWAYS follow immediately after the financial statements. They will be marked as "Note 1", etc., in sequential order. NOTE: Despite what it says, the financial statements actually start on page 73 of the pdf (they have an error in their table of contents). Go to Note 1 (following the financial statements). Skim through the Note until you find the tables that contain the segment data you need to perform ROI, margin, and residual income calculations. SECTION II 1. Open a new Excel spreadsheet and set up four column headings: Division Name; Assets; Operating Income; Revenue. Expand column widths as needed. 2. Save the Excel spreadsheet with the name "Project 3 Your Name". 3. List the seven division names using their abbreviations. 4. Input the 2019 data for each segment. (Do not include "corporate unallocated or the total of all divisions.) 5. Use the "Number" section of the menu bar to format the data as "currency" (dollar signs and commas). Use the "decimal remove" button to delete unnecessary decimals. 6. Use "Format as a Table" or shading to improve the visual look of your data table. Play around with the different design options. 7. Next, you will be adding a graph to visually display this data. To do this, highlight the entire table. Then click on the "insert" tab on the menu bar. Then click on the "Column" chart. (Depending on your version of Excel, you might need to click on "Recommended Charts". Choose an appropriate layout from those available. Add the title "Segment Data" to your chart. Expand the chart size if needed. 8. Add a textbox ("Insert" on menu bar; "Textbox") and answer the following questions: i. Briefly describe each of the segments and give some examples of the products or geographical territory. (Remember pages 2, 3 and 4 from above.) ii. Comment on the graph: What stands out to you? iii. Color/fill in the textbox to coordinate with the graph. Use "Format" on the menu bar; "Shape Fill" and choose the color. SECTION INI 9. Add a new table somewhere below the first section. The second data table should have the following column headings: Division, ROI, Margin, and Residual Income. "Copy" and "paste" the division names into the new table. 10. Use "Format as a Table or shading to improve the visual look of your data table. 11. For the first company division listed, insert formula commands to calculate ROI, margin, and residual income (assume the company has a 25% target rate of return). To insert formulas, highlight the cell where you want to place the answer. Then, for example, type in "=B2/B3" to divide the figure in cell B2 by the figure in cell B3. 12. Use the "%" on the "Number" section of the menu bar to format the ROI and margin as percentages. Format the residual income as a dollar amount using the $ sign above the word number. Show 2 decimal places. 13. Use the "Copy" and "Paste" commands to copy the same formulas into the appropriate cell for each division. 14. Add a column graph that compares the ROI of each division. Add a title and size the graph as needed. (Only the graph of the ROI is required. You DO NOT need to make graphs of the other ratios.) 15. Add one textbox for EACH of the following: (REMEMBER..... use complete sentences in your answers.) i. ROI: What does ROI tell management? Which divisions have the best and worst ROI or are they roughly the same? How do they compare? How could a division of this company improve its ROI? Give an example of a specific action that could be taken to improve ROI. ii. Margin: What does margin tell management? Which divisions have the best and worst margins or are they roughly the same? How do they compare? How could a division of this company improve its' margin? Give an example of a specific action that could be taken to improve sales margin. iii. Residual Income: What does residual income tell management? Do any of the divisions fall short of management's expectations? How can you tell? iv. Allocation decision: If you were upper management (CEO of the whole corporation), and had excess funds to allocate among divisions, which division would you allocate those funds to and why
Step by Step Solution
There are 3 Steps involved in it

Get step-by-step solutions from verified subject matter experts