

Question: Section 1. Balance Sheet - Overview 1. What are the following amounts at 1/30/21: a. b. c. Total Assets Total Liabilities Total Owner's Equity 2.
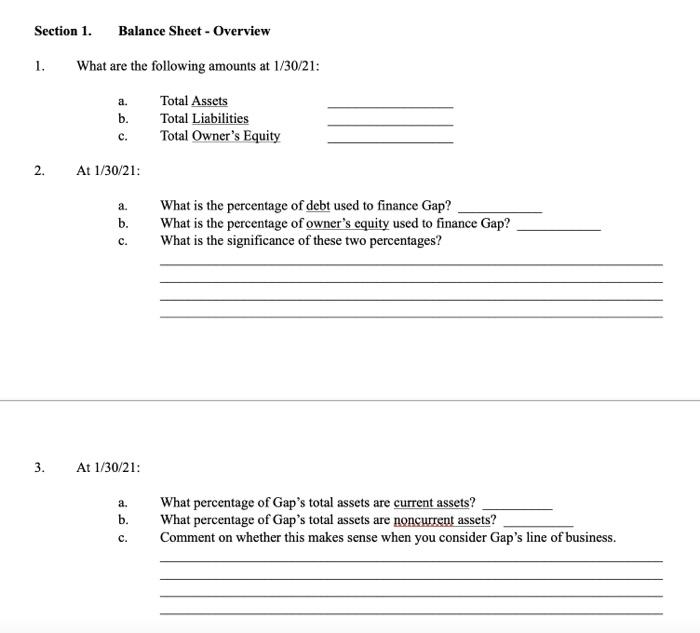
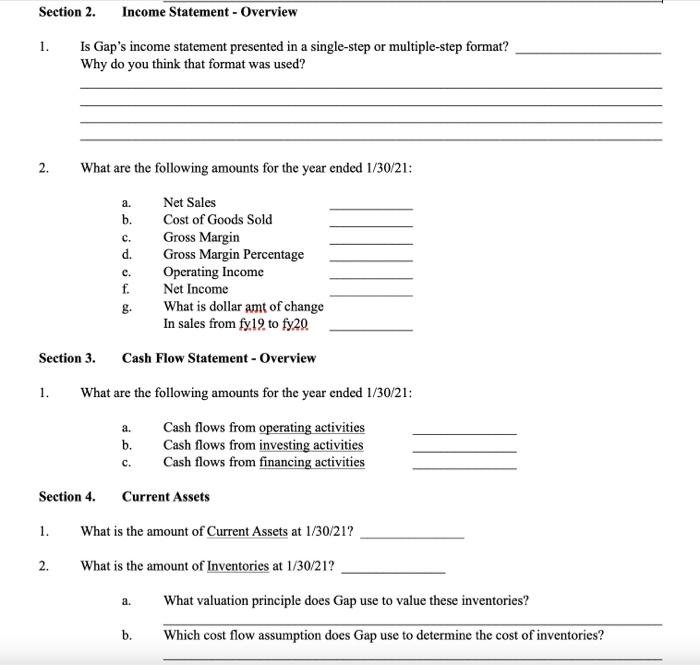
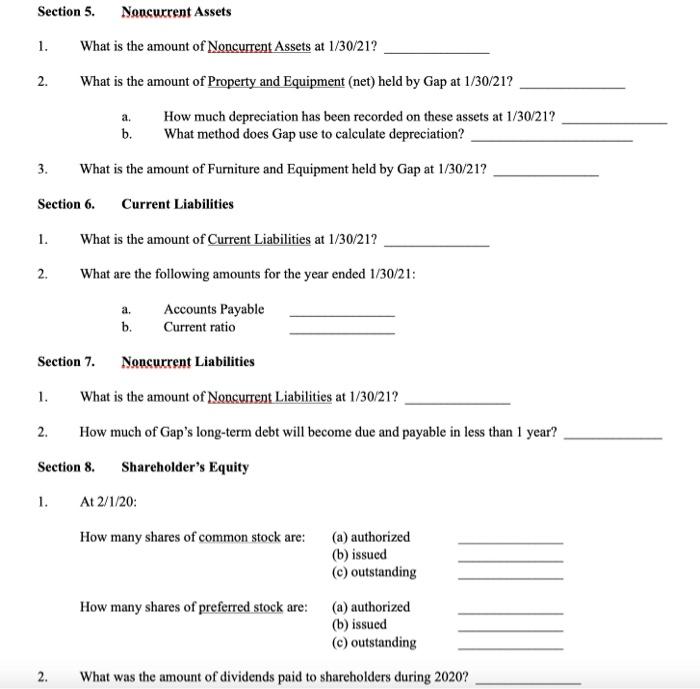
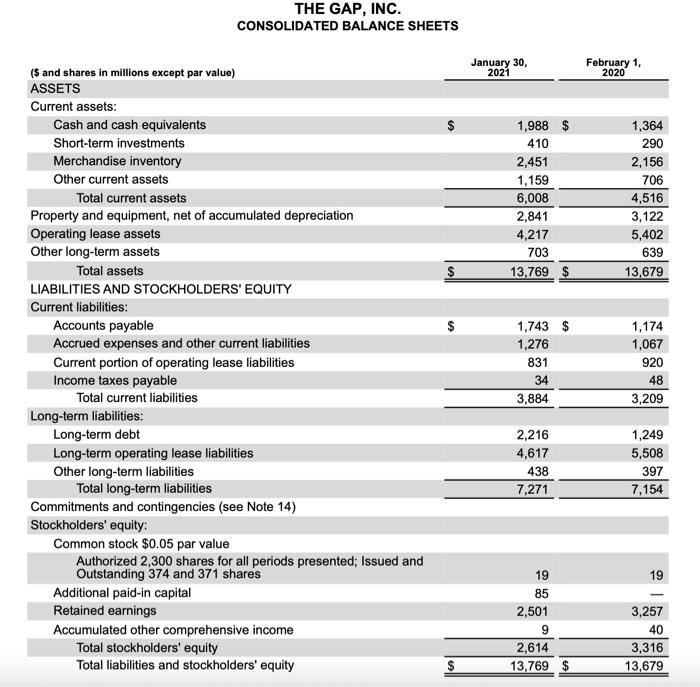
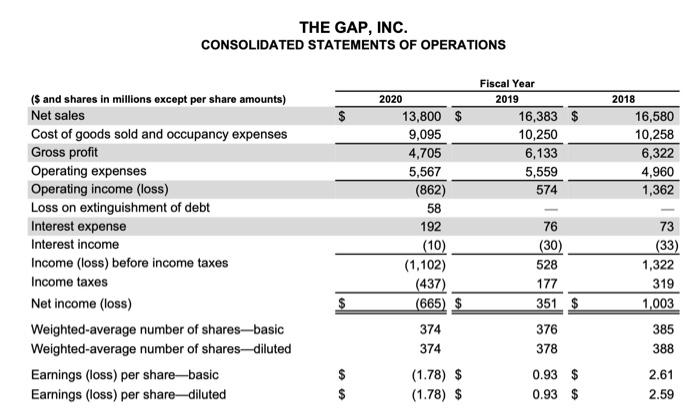
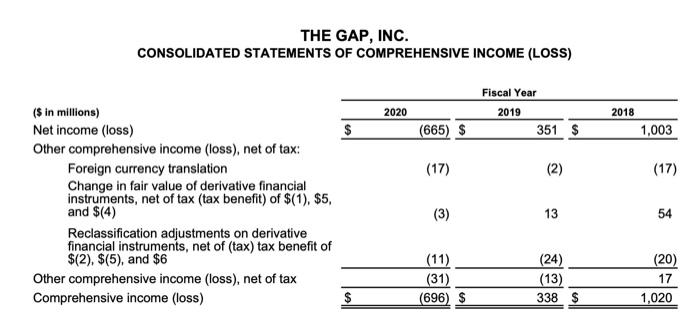
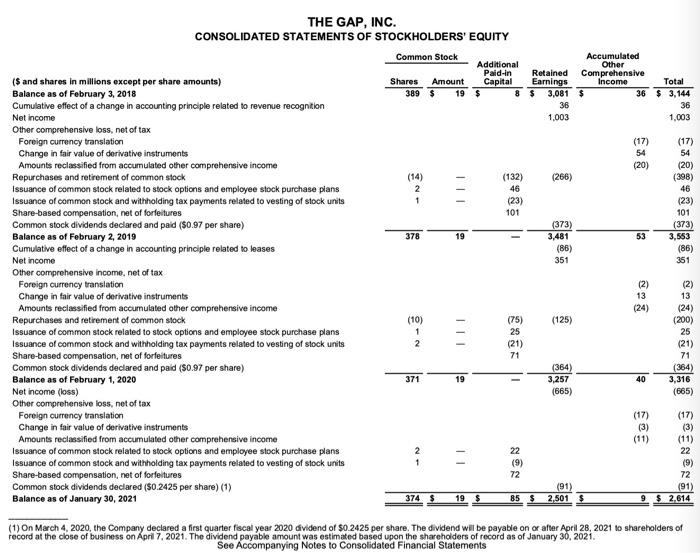
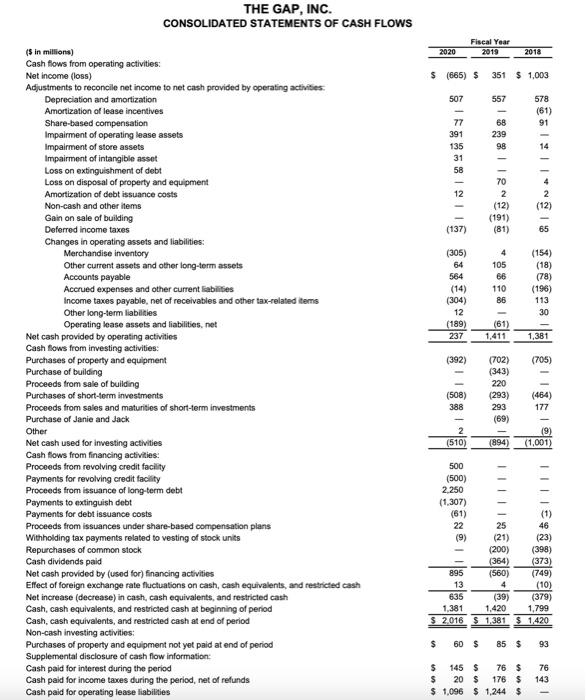
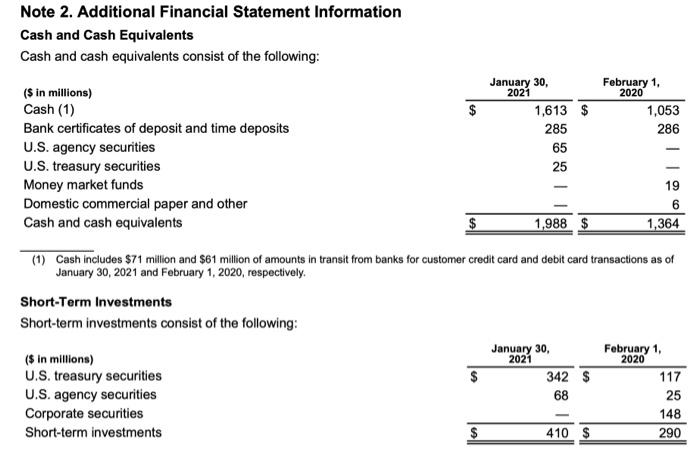
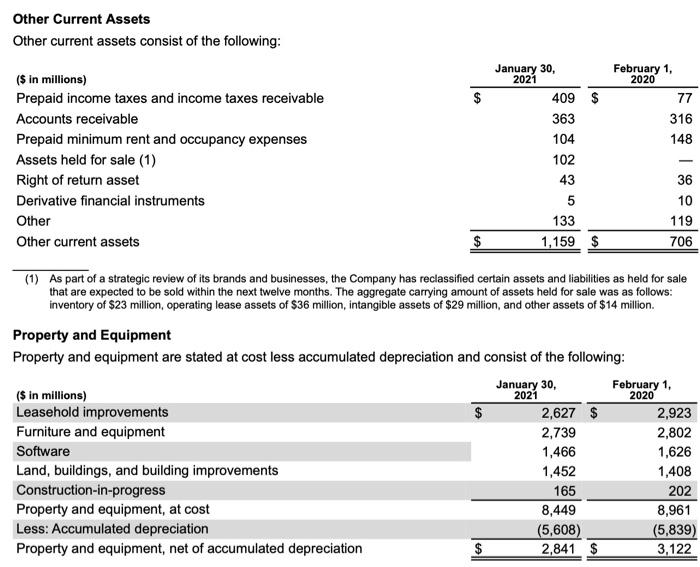
Section 1. Balance Sheet - Overview 1. What are the following amounts at 1/30/21: a. b. c. Total Assets Total Liabilities Total Owner's Equity 2. At 1/30/21: a b. C. What is the percentage of debt used to finance Gap? What is the percentage of owner's equity used to finance Gap? What is the significance of these two percentages? 3. At 1/30/21: a. b. What percentage of Gap's total assets are current assets? What percentage of Gap's total assets are noncurrent assets? Comment on whether this makes sense when you consider Gap's line of business. c. Section 2. Income Statement - Overview 1. Is Gap's income statement presented in a single-step or multiple-step format? Why do you think that format was used? 2. What are the following amounts for the year ended 1/30/21: odoh a. b. c . e. f. Net Sales Cost of Goods Sold Gross Margin Gross Margin Percentage Operating Income Net Income What is dollar amt of change In sales from fy19 to fy20 Section 3. Cash Flow Statement - Overview 1. What are the following amounts for the year ended 1/30/21: Cash flows from operating activities b. Cash flows from investing activities Cash flows from financing activities a. c. Section 4. Current Assets 1. What is the amount of Current Assets at 1/30/21? What is the amount of Inventories at 1/30/21? 2. a. What valuation principle does Gap use to value these inventories? b. Which cost flow assumption does Gap use to determine the cost of inventories? Section 5. Noncurrent Assets 1. What is the amount of Noncurrent Assets at 1/30/21? What is the amount of Property and Equipment (net) held by Gap at 1/30/21? 2. a. b. How much depreciation has been recorded on these assets at 1/30/21? What method does Gap use to calculate depreciation? 3. What is the amount of Furniture and Equipment held by Gap at 1/30/21? Section 6. Current Liabilities 1. What is the amount of Current Liabilities at 1/30/21? What are the following amounts for the year ended 1/30/21: 2. a. b. Accounts Payable Current ratio Section 7. Noncurrent Liabilities 1. What is the amount of Noncurrent Liabilities at 1/30/21? 2. How much of Gap's long-term debt will become due and payable in less than 1 year? Section 8. Shareholder's Equity 1. At 2/1/20: How many shares of common stock are: (a) authorized (b) issued (c) outstanding How many shares of preferred stock are: (a) authorized (b) issued (c) outstanding 2. What was the amount of dividends paid to shareholders during 2020? THE GAP, INC. CONSOLIDATED BALANCE SHEETS January 30, 2021 February 1, 2020 1,988 $ 410 2,451 1,159 6,008 2,841 4,217 703 13,769 $ 1,364 290 2,156 706 4,516 3,122 5,402 639 13,679 $ ($ and shares in millions except par value) ASSETS Current assets: Cash and cash equivalents Short-term investments Merchandise inventory Other current assets Total current assets Property and equipment, net of accumulated depreciation Operating lease assets Other long-term assets Total assets LIABILITIES AND STOCKHOLDERS' EQUITY Current liabilities: Accounts payable Accrued expenses and other current liabilities Current portion of operating lease liabilities Income taxes payable Total current liabilities Long-term liabilities: Long-term debt Long-term operating lease liabilities Other long-term liabilities Total long-term liabilities Commitments and contingencies (see Note 14) Stockholders' equity: Common stock $0.05 par value Authorized 2,300 shares for all periods presented; Issued and Outstanding 374 and 371 shares Additional paid-in capital Retained earnings Accumulated other comprehensive income Total stockholders' equity Total liabilities and stockholders' equity 1,743 $ 1,276 831 34 3,884 1,174 1,067 920 48 3,209 1,249 5,508 2,216 4,617 438 7,271 397 7,154 19 19 85 2,501 9 2,614 13,769 $ 3,257 40 3,316 13,679 $ THE GAP, INC. CONSOLIDATED STATEMENTS OF OPERATIONS Fiscal Year 2019 16,383 $ 10,250 6,133 5,559 574 2018 16,580 10,258 6,322 4,960 1,362 ($ and shares in millions except per share amounts) Net sales Cost of goods sold and occupancy expenses Gross profit Operating expenses Operating income (loss) Loss on extinguishment of debt Interest expense Interest income Income (loss) before income taxes Income taxes Net income (loss) Weighted-average number of shares-basic Weighted-average number of shares-diluted Earnings (loss) per share-basic Earnings (loss) per share-diluted 2020 13,800 $ 9,095 4,705 5,567 (862) 58 192 (10) (1,102) (437) (665) $ 374 374 73 (33) 76 (30) 528 177 351 $ 1,322 319 1,003 $ 376 378 385 388 (1.78) $ (1.78) $ 0.93 $ 0.93 $ 2.61 2.59 THE GAP, INC. CONSOLIDATED STATEMENTS OF COMPREHENSIVE INCOME (LOSS) Fiscal Year 2019 351 $ 2018 2020 (665) $ $ 1,003 (17) (2) (17) (s in millions) Net income (loss) Other comprehensive income (loss), net of tax: Foreign currency translation Change in fair value of derivative financial instruments, net of tax (tax benefit) of $(1). $5, and $(4) Reclassification adjustments on derivative financial instruments, net of (tax) tax benefit of $(2), $(5), and $6 Other comprehensive income (loss), net of tax Comprehensive income (loss) (3) 13 54 (11) (31) (696) $ (24) (13) 338 $ (20) 17 1,020 $ 101 THE GAP, INC. CONSOLIDATED STATEMENTS OF STOCKHOLDERS' EQUITY Common Stock Additional Accumulated Other Paid-in ($ and shares in millions except per share amounts) Retained Comprehensive Shares Amount Capital Earnings Income Total Balance as of February 3, 2018 389 $ 19 $ 8 $ 3,081 $ 36 $ 3,144 Cumulative effect of a change in accounting principle related to revenue recognition 36 36 Net income 1,003 1,003 Other comprehensive loss, net of tax Foreign currency translation (17) Change in fair value of derivative instruments 54 Amounts reclassified from accumulated other comprehensive income (20) Repurchases and retirement of common stock (14) (132) (266) Issuance of common stock related to stock options and employee stock purchase plans 2 46 Issuance of common stock and withholding tax payments related to vesting of stock units 1 (23) Share-based compensation, not of forfeitures Common stock dividends declared and paid ($0.97 per share) (373) (373) Balance as of February 2, 2019 378 19 3,481 53 3,553 Cumulative effect of a change in accounting principle related to leases (86) Net income 351 Other comprehensive income, net of tax Foreign currency translation (2) Change in fair value of derivative instruments 13 Amounts reclassified from accumulated other comprehensive income (24) Repurchases and retirement of common stock (10) (75) (125) (200) Issuance of common stock related to stock options and employee stock purchase plans 1 25 Issuance of common stock and withholding tax payments related to vesting of stock units 2. (21) Share-based compensation, net of forfeitures 71 Common stock dividends declared and paid (50.97 per share) (364) (364) Balance as of February 1, 2020 371 19 3.257 40 3,316 Net Income (loss) (665) (665) Other comprehensive loss, net of tax Foreign currency translation (17) Change in fair value of derivative instruments (3) Amounts reclassified from accumulated other comprehensive income (11) Issuance of common stock related to stock options and employee stock purchase plans 22 Issuance of common stock and withholding tax payments related to vesting of stock units (9) Share-based compensation, net of forfeitures 72 Common stock dividends declared (50.2425 per share) (1) (91) Balance as of January 30, 2021 3743 19 $ 85 $ 2,501 $ 9 $ 2.614 Sma3 SIRET 23 - a (1) On March 4, 2020, the Company declared a first quarter fiscal year 2020 dividend of 50.2425 per share. The dividend wil be payable on or after April 28, 2021 to shareholders of record at the close of business on April 7, 2021. The dividend payable amount was estimated based upon the shareholders of record as of January 30, 2021. See Accompanying Notes to Consolidated Financial Statements THE GAP, INC. CONSOLIDATED STATEMENTS OF CASH FLOWS Fiscal Year 2010 2020 2018 $ (685) $ 351 $ 1,003 507 578 (61) 91 77 391 135 31 58 14 12 189812B *88% (12) (191) (137) 65 (305) 64 564 (14) (304) 12 (189) 237 (154) (18) (78) (196) 113 30 (61) 1,411 1,381 (392) (705) (5 in millions) Cash flows from operating activities: Net income (loss) Adjustments to reconcile net income to net cash provided by operating activities Depreciation and amortization Amortization of lease incentives Share-based compensation Impairment of operating lease assets Impairment of store assets Impairment of intangible asset Loss on extinguishment of debt Loss on disposal of property and equipment Amortization of debt issuance costs Non-cash and other items Gain on sale of building Deferred income taxes Changes in operating assets and liabilities: Merchandise inventory Other current assets and other long-term assets Accounts payable Accrued expenses and other current liabilities Income taxes payable, net of receivables and other tax-related items Other long-term liabilities Operating lease assets and liabilities.net Net cash provided by operating activities Cash flows from investing activities: Purchases of property and equipment Purchase of building Proceeds from sale of building Purchases of short-term investments Proceeds from sales and maturities of short-term investments Purchase of Janie and Jack Other Net cash used for investing activities Cash flows from financing activities Proceeds from revolving credit facility Payments for revolving credit facility Proceeds from issuance of long-term debt Payments to extinguish debt Payments for debt issuance costs Proceeds from issuances under share-based compensation plans Withholding tax payments related to vesting of stock units Repurchases of common stock Cash dividends paid Net cash provided by (used for) financing activities Effect of foreign exchange rate fluctuations on cash, cash equivalents, and restricted cash Net increase (decrease) in cash, cash equivalents, and restricted cash Cash, cash equivalents, and restricted cash at beginning of period Cash, cash equivalents, and restricted cash at end of period Non-cash investing activities: Purchases of property and equipment not yet paid at end of period Supplemental disclosure of cash flow information: Cash paid for interest during the period Cash paid for income taxes during the period, net of refunds Cash paid for operating lease liabilities (702) (343) 220 (293) 293 (69) (508) 388 (464) 177 2 (510) (9) (1,001) (894) 500 (500) 2.250 (1.307) (61) 22 25 46 (9) (21) (23) (200) (398) (364) (373) 895 (560) (749) 13 (10) 635 (39) (379) 1.381 1,420 1,799 $ 2.016 $ 1,381 $ 1,420 all 1383 $ 60 $ 85$ 93 $ 145 $ 76 $ $ 20 $ 176 $ $ 1,096 $ 1,244 $ 76 143 Note 2. Additional Financial Statement Information Cash and Cash Equivalents Cash and cash equivalents consist of the following: $ January 30, 2021 1,613 $ 285 65 25 February 1. 2020 1,053 286 (s in millions) Cash (1) Bank certificates of deposit and time deposits U.S. agency securities U.S. treasury securities Money market funds Domestic commercial paper and other Cash and cash equivalents 19 6 1,364 $ 1,988 $ (1) Cash includes $71 million and $61 million of amounts in transit from banks for customer credit card and debit card transactions as of January 30, 2021 and February 1, 2020, respectively. Short-Term Investments Short-term investments consist of the following: January 30, February 1, ($ in millions) U.S. treasury securities $ 342 $ 117 U.S. agency securities 68 25 Corporate securities 148 Short-term investments $ 410 $ 2021 2020 290 Other Current Assets Other current assets consist of the following: February 1, 2020 77 316 148 (s in millions) Prepaid income taxes and income taxes receivable Accounts receivable Prepaid minimum rent and occupancy expenses Assets held for sale (1) Right of return asset Derivative financial instruments Other Other current assets January 30, 2021 409 $ 363 104 102 43 5 133 1,159 $ 36 10 119 706 $ 2021 2020 (1) As part of a strategic review of its brands and businesses, the Company has reclassified certain assets and liabilities as held for sale that are expected to be sold within the next twelve months. The aggregate carrying amount of assets held for sale was as follows: inventory of $23 million, operating lease assets of $36 million, intangible assets of $29 million, and other assets of $14 million. Property and Equipment Property and equipment are stated at cost less accumulated depreciation and consist of the following: January 30, February 1, ($ in millions) Leasehold improvements $ 2,627 $ 2,923 Furniture and equipment 2,739 2,802 Software 1,466 1,626 Land, buildings, and building improvements 1,452 1,408 Construction-in-progress 165 202 Property and equipment, at cost 8,449 8,961 Less: Accumulated depreciation (5,608) (5,839) Property and equipment, net of accumulated depreciation $ 2,841 $ 3,122
Step by Step Solution
There are 3 Steps involved in it

Get step-by-step solutions from verified subject matter experts