

Question: Section 1: Vertical Analysis (Common Size Analysis) Perform a vertical analysis in relation to revenue for the items on the income statement only for each
Section 1: Vertical Analysis (Common Size Analysis)
Perform a vertical analysis in relation to revenue for the items on the income statement only for each of the two companies. (18 marks)
Section 2: Ratio Analysis
Compute the ratios for the following categories for each company:
- Profitability
- Liquidity
- Solvency
- market value
Present in chart form and show calculations used. (36 marks)
Discussion of ratios (46 marks) For each ratio, students should comment on some of the following
- What is the relative position of each of the corporations?
- What is being measured?
- What does it mean? Is this good news or bad
Section 3: Conclusions/Recommendations
Draw conclusions from the data that was gathered in the previous sections and determine the relevant position of each of the corporations in all of the analyses.
The conclusions/recommendations must address the following as a comparison between the two companies.
- Summarize the overall strengths and weaknesses of each corporation?
- Your final recommendation as to which company your client should invest in explaining key reasons why it is the better choice.
DATA:
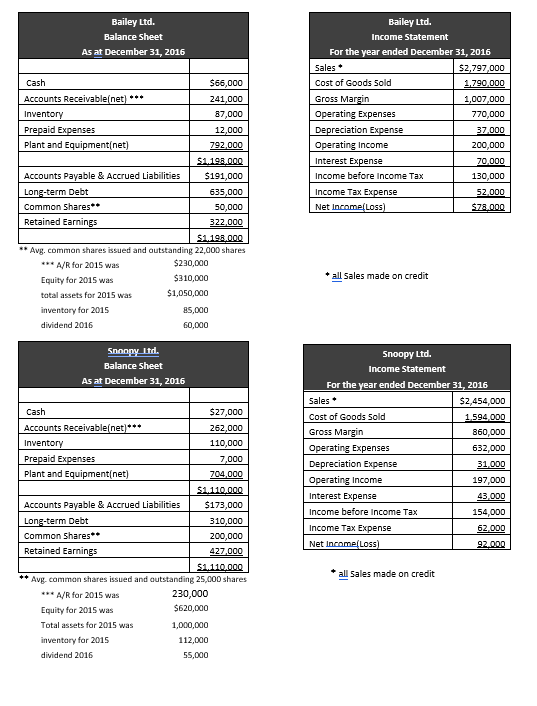
Bailey Ltd. Balance Sheet As at December 31, 2016 Cash Accounts Receivable(net) *** Inventory Prepaid Expenses Plant and Equipment(net) $1,198,000 $191,000 635,000 50,000 322,000 $1.198.000 ** Avg. common shares issued and outstanding 22,000 shares ***A/R for 2015 was Accounts Payable & Accrued Liabilities Long-term Debt Common Shares** Retained Earnings Equity for 2015 was total assets for 2015 was inventory for 2015 dividend 2016 Cash Accounts Receivable(net)*** Inventory Prepaid Expenses Plant and Equipment(net) Snoopy Ltd. Balance Sheet As at December 31, 2016 $230,000 $310,000 $1,050,000 Accounts Payable & Accrued Liabilities Long-term Debt Common Shares** Retained Earnings Equity for 2015 was Total assets for 2015 was inventory for 2015 dividend 2016 85,000 60,000 $66,000 241,000 87,000 12,000 792,000 $27,000 262,000 110,000 7,000 704,000 $1.110,000 $173,000 $1.110,000 ** Avg. common shares issued and outstanding 25,000 shares ***A/R for 2015 was 230,000 $620,000 1,000,000 112,000 55,000 310,000 200,000 427,000 Bailey Ltd. Income Statement For the year ended December 31, 2016 Sales* $2,797,000 Cost of Goods Sold 1,790,000 Gross Margin Operating Expenses Depreciation Expense Operating Income Interest Expense Income before Income Tax Income Tax Expense Net Income(Loss) * all Sales made on credit Snoopy Ltd. Income Statement Sales* Cost of Goods Sold Gross Margin Operating Expenses Depreciation Expense Operating Income Interest Expense Income before Income Tax For the year ended December 31, 2016 Income Tax Expense Net Income(Loss) 1,007,000 770,000 37,000 200,000 all sales made on credit 70,000 130,000 52,000 $78.000 $2,454,000 1,594,000 860,000 632,000 31,000 197,000 43,000 154,000 62,000 92,000
Step by Step Solution
There are 3 Steps involved in it

Get step-by-step solutions from verified subject matter experts