

Question: SECTION 12.2: FREQUENCY DISTRIBUTIONS AND STATISTICAL GRAPHS 1. Use the histogram below to answer the following questions. a. How many people were staying in the
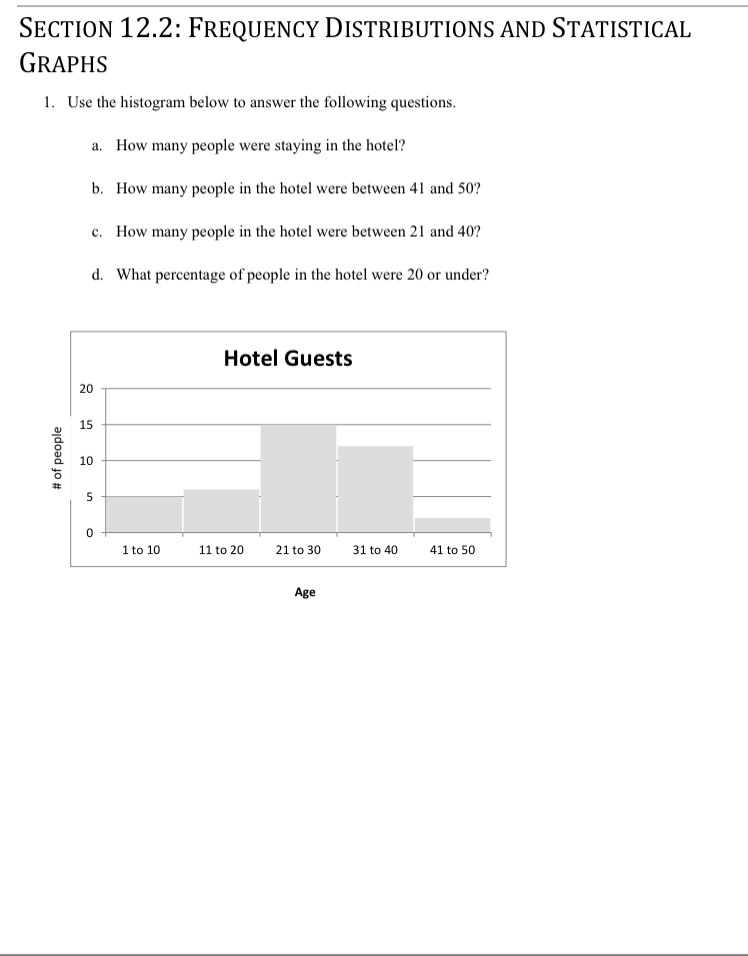
SECTION 12.2: FREQUENCY DISTRIBUTIONS AND STATISTICAL GRAPHS 1. Use the histogram below to answer the following questions. a. How many people were staying in the hotel? b. How many people in the hotel were between 41 and 50? c. How many people in the hotel were between 21 and 40? d. What percentage of people in the hotel were 20 or under? Hotel Guests 20 15 # of people 10 5 1 to 10 11 to 20 21 to 30 31 to 40 41 to 50 Age
Step by Step Solution
There are 3 Steps involved in it
1 Expert Approved Answer
Step: 1 Unlock

Question Has Been Solved by an Expert!
Get step-by-step solutions from verified subject matter experts
Step: 2 Unlock
Step: 3 Unlock