

Question: Section 2 - 4: Pareto Graph Graphs 1. Construct a Pareto Graph for the table shown below. Jobs added in the last 18 months Frequency
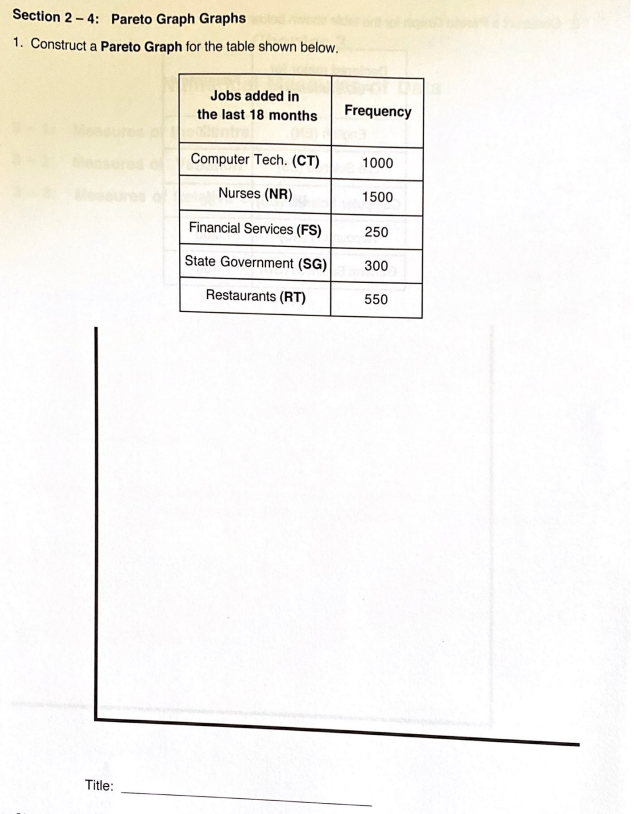
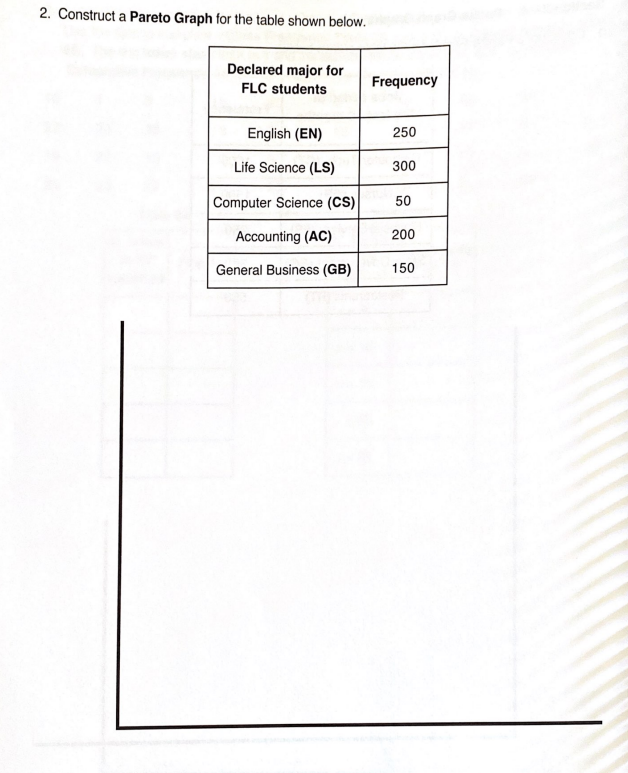
Section 2 - 4: Pareto Graph Graphs 1. Construct a Pareto Graph for the table shown below. Jobs added in the last 18 months Frequency Computer Tech. (CT) 1000 Nurses (NR) 1500 Financial Services (FS) 250 State Government (SG) 300 Restaurants (RT) 550 Title:2. Construct a Pareto Graph for the table shown below. Declared major for FLC students Frequency English (EN) 250 Life Science (LS) 300 Computer Science (CS) 50 Accounting (AC) 200 General Business (GB) 150
Step by Step Solution
There are 3 Steps involved in it
1 Expert Approved Answer
Step: 1 Unlock

Question Has Been Solved by an Expert!
Get step-by-step solutions from verified subject matter experts
Step: 2 Unlock
Step: 3 Unlock