

Question: Section 2.3 Exercise 7 Question Help The human resource group for a company collected data summarizing the educational levels and tenures of the company's employees.
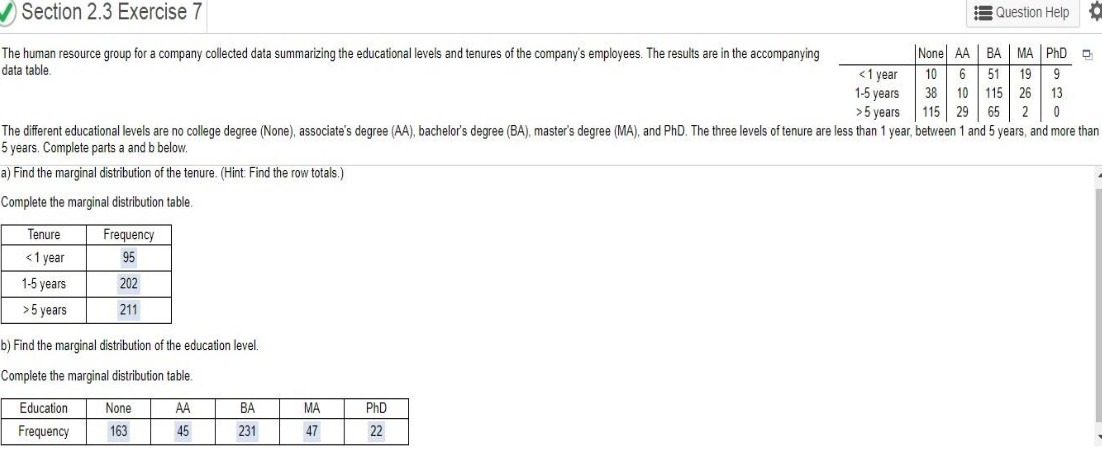
Section 2.3 Exercise 7 Question Help The human resource group for a company collected data summarizing the educational levels and tenures of the company's employees. The results are in the accompanying None | AA BA MA PhD data table. 5 years 115 29 65 0 The different educational levels are no college degree (None), associate's degree (AA), bachelor's degree (BA), master's degree (MA), and PhD. The three levels of tenure are less than 1 year, between 1 and 5 years, and more than 5 years. Complete parts a and b below. a) Find the marginal distribution of the tenure. (Hint: Find the row totals.) Complete the marginal distribution table. Tenure Frequency 5 years 211 b) Find the marginal distribution of the education level. Complete the marginal distribution table Education None AA BA MA PhD Frequency 163 45 231 47 22
Step by Step Solution
There are 3 Steps involved in it

Get step-by-step solutions from verified subject matter experts