

Question: Section 2.3 x @ Do Homework - 2.3 Homework X + C mathxl.com/Student/PlayerHomework.aspx?homeworkld=621140410&questionld=1&flushed=false&cld=6885670&back=https://www.mathxl.com/Student/OverviewAssignment.aspx?home.. Q 22SP MAT 135-401 Bruchey Priscilla Ochonog Homework: 2.3 Homework Question 6,
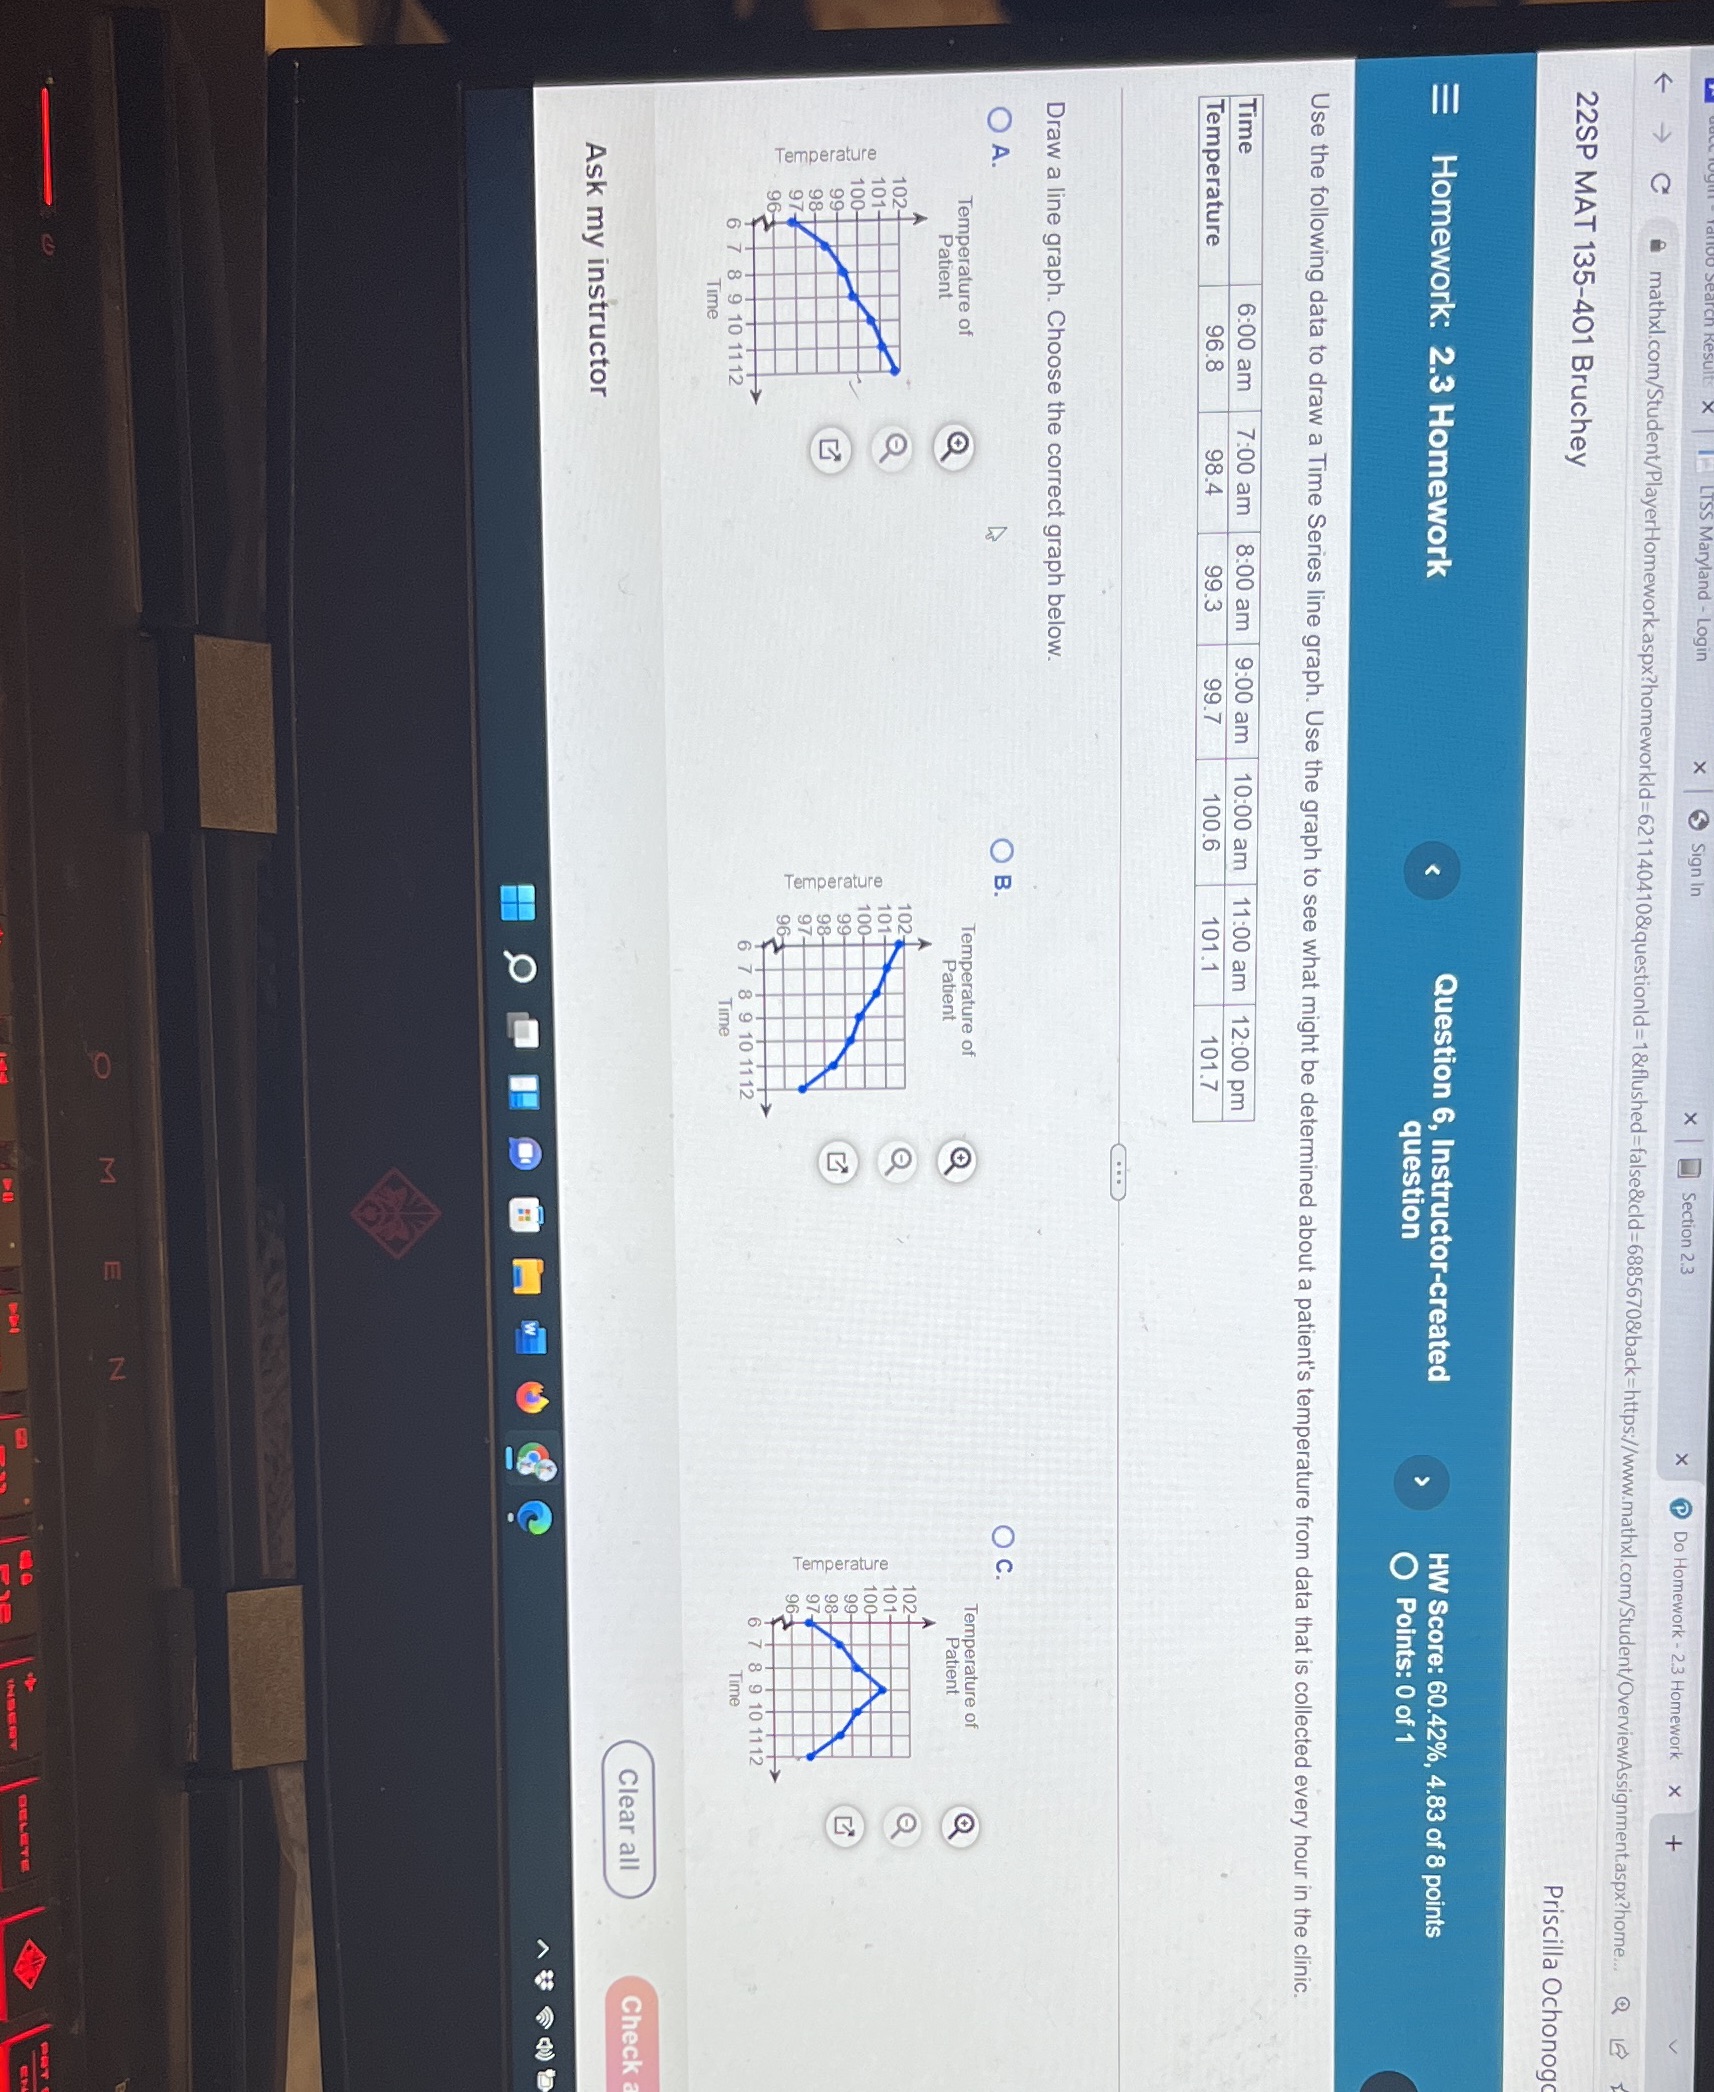
Section 2.3 x @ Do Homework - 2.3 Homework X + C mathxl.com/Student/PlayerHomework.aspx?homeworkld=621140410&questionld=1&flushed=false&cld=6885670&back=https://www.mathxl.com/Student/OverviewAssignment.aspx?home.. Q 22SP MAT 135-401 Bruchey Priscilla Ochonog Homework: 2.3 Homework Question 6, Instructor-created HW Score: 60.42%, 4.83 of 8 points question Points: 0 of 1 Use the following data to draw a Time Series line graph. Use the graph to see what might be determined about a patient's temperature from data that is collected every hour in the clinic. Time 6:00 am 7:00 am 8:00 am 9:00 am 10:00 am 11:00 am 12:00 pm Temperature 96.8 98.4 99.3 99.7 100.6 101.1 101.7 Draw a line graph. Choose the correct graph below. O O B. O C. Temperature of Temperature of Temperature of Patient Patient Patient at 102- 1027 10 101- 101- 100- 100 100- 99-4 99 emperature ratur 99- 98- 984 98- 97- Temp 97_ 97- emp 96 96- 6 7 8 9 10 11 12 6 7 8 9 10 1112 6 7 8 9 10 11 12 Time Time Time Clear all Check Ask my instructor Z O - BELEYE
Step by Step Solution
There are 3 Steps involved in it

Get step-by-step solutions from verified subject matter experts