

Question: SECTION 4 1 1 Predicting Land Value Both scatterplots concern the ssessed value of land with homes on the land and both depict he same
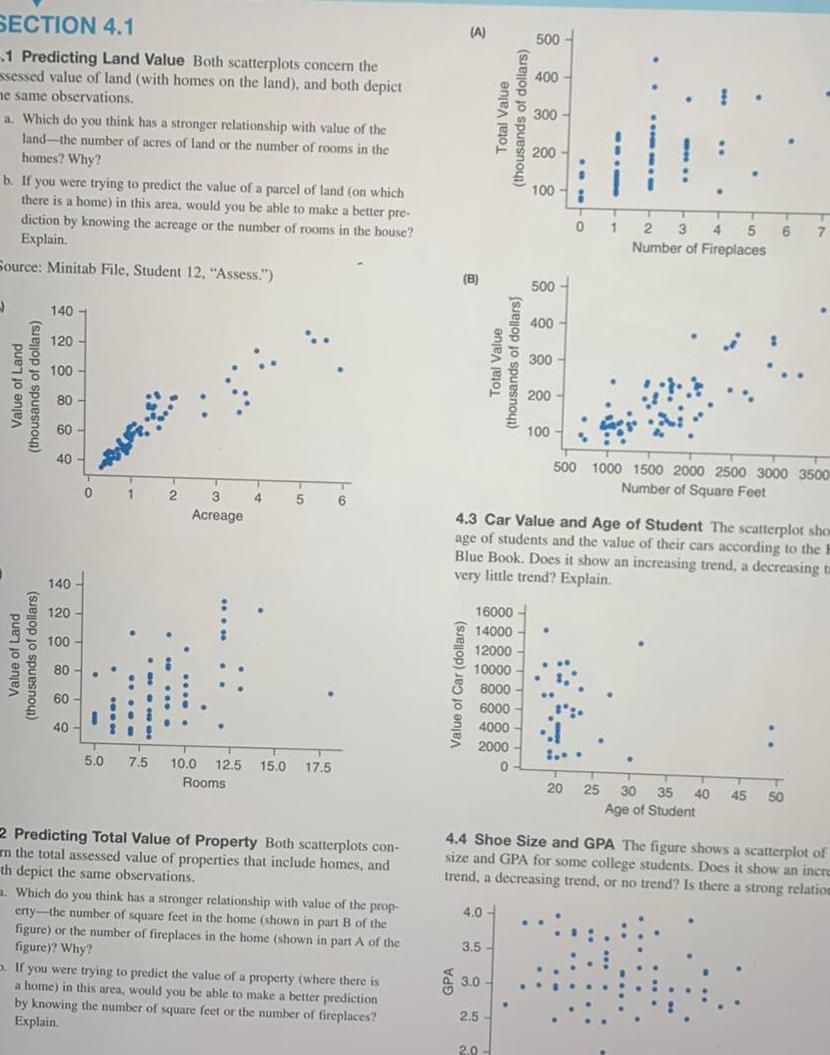

SECTION 4 1 1 Predicting Land Value Both scatterplots concern the ssessed value of land with homes on the land and both depict he same observations a Which do you think has a stronger relationship with value of the land the number of acres of land or the number of rooms in the homes Why b If you were trying to predict the value of a parcel of land on which there is a home in this area would you be able to make a better pre diction by knowing the acreage or the number of rooms in the house Explain Source Minitab File Student 12 Assess J Value of Land thousands of dollars s of dollars Value of Land thousands 140 120 100 80 60 40 140 120 100 80 60 40 1 2 3 Acreage 4 5 5 0 7 5 10 0 12 5 15 0 17 5 Rooms 6 2 Predicting Total Value of Property Both scatterplots con n the total assessed value of properties that include homes and th depict the same observations a Which do you think has a stronger relationship with value of the prop erty the number of square feet in the home shown in part B of the figure or the number of fireplaces in the home shown in part A of the figure Why If you were trying to predict the value of a property where there is a home in this area would you be able to make a better prediction by knowing the number of square feet or the number of fireplaces Explain A B Value of Car dollars Total Value thousands of dollars 6000 4000 2000 0 4 0 Total Value thousands of dollars 16000 14000 12000 10000 8000 3 5 3 0 2 5 500 2 0 400 300 200 100 500 400 300 4 3 Car Value and Age of Student The scatterplot show age of students and the value of their cars according to the l Blue Book Does it show an increasing trend a decreasing ta very little trend Explain 200 100 0 500 1000 1500 2000 2500 3000 3500 Number of Square Feet 1 J 1 2 3 4 5 6 Number of Fireplaces 20 25 4 4 Shoe Size and GPA The figure shows a scatterplot of size and GPA for some college students Does it show an incre trend a decreasing trend or no trend Is there a strong relation 30 35 Age of Student 40 45 50
Step by Step Solution
There are 3 Steps involved in it

Get step-by-step solutions from verified subject matter experts