

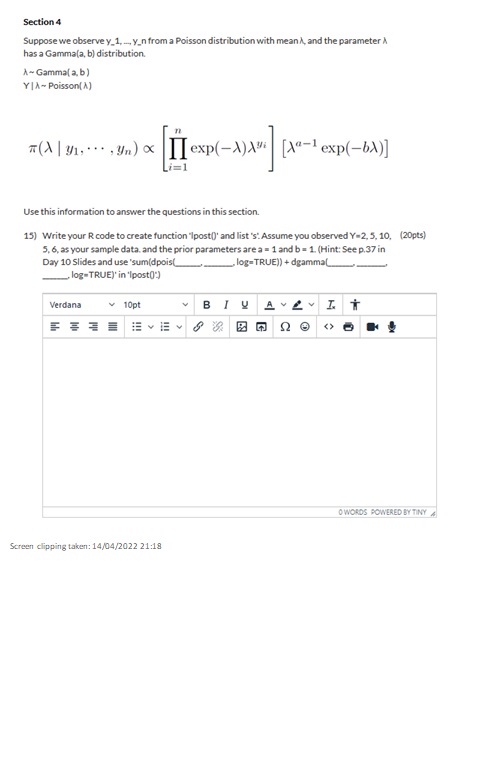
Question: Section 4 Suppose we observe y_1, .., _n from a Poisson distribution with mean k, and the parameter A has a Gamma(a, b] distribution. A
![distribution with mean k, and the parameter A has a Gamma(a, b]](https://s3.amazonaws.com/si.experts.images/answers/2024/06/66774b2bc115b_05966774b2bb0d34.jpg)
![distribution. A = Gamma[ a, b) Y| A- Poisson[ A] n I](https://s3.amazonaws.com/si.experts.images/answers/2024/06/66774b2c37768_06066774b2c1ec7e.jpg)
![exp(-A)10 [1"-1 exp(-bx)] 1=1 Use this information to answer the questions in](https://s3.amazonaws.com/si.experts.images/answers/2024/06/66774b2c9d27f_06066774b2c8233f.jpg)
Section 4 Suppose we observe y_1, .., _n from a Poisson distribution with mean k, and the parameter A has a Gamma(a, b] distribution. A = Gamma[ a, b) Y| A- Poisson[ A] n I exp(-A)10 [1"-1 exp(-bx)] 1=1 Use this information to answer the questions in this section. 15) Write your R code to create function "Ipost[)' and list's' Assume you observed Y=2, 5, 10, (20pts) 5, 6, as your sample data. and the prior parameters are a = 1 and b = 1. (Hint: See p.37 in Day 10 Slides and use 'sum(dpois( log=TRUE)) + dgammal .log-TRUE)' in 'lpost(") Verdana 10pt B O WORDS POWERED BY TINY Screen clipping taken: 14/04/2022 21:1816) Write your R code to collect 1,000 simulated Y values from the posterior distribution. Use (15pts) a starting value of 1=5 and a neighborhood scale value of C=2. Make sure you use "set.seed( 123 )' before your code to get the same outcome. (Hint: See p.38 in Day 10 Slides.) Verdana 10pt B IY E VEY ( > OWORDS POWERED BY TINY 17) Use your answer to Question 16 to find the acceptance rate. (10pts) 18) Write your R code to create a trace plot on your simulated Y values. (15pts) Verdana 10pt BIU E VEY ne
Step by Step Solution
There are 3 Steps involved in it

Get step-by-step solutions from verified subject matter experts