

Question: Section Exercise 3-2 (Algo) Consider the following table of data. Defects per 100 Vehicles (alphabetical by brand) Brand Defects Brand Defects Brand Acura 107 Mini
Section Exercise 3-2 (Algo) Consider the following table of data. Defects per 100 Vehicles (alphabetical by brand) Brand Defects Brand Defects Brand Acura 107 Mini Audi 111 113 BMW Buick Cadillac 114 111 Chevrolet 111 Chrysler 123 138 94 130 90 Dodge Ford GMC Honda Hyundai Infiniti Jaguar Jeep Kia Land Rover Lexus Lincoln Mazda stem unit leaf unit Mercedes-Benz Mercury Stem-and-Leaf plot for = Click here for the Excel Data File (a) Construct a stem-and-leaf plot for the number of defects per 100 vehicles for these 32 brands. = 103 101 124 123 124 170 87 92 114 92 113 Defects Mitsubishi Nissan Porsche Ram Scion Subaru Toyota Volkswagen Volvo Defects 122 144 111 94 110 114 129 117 135 102
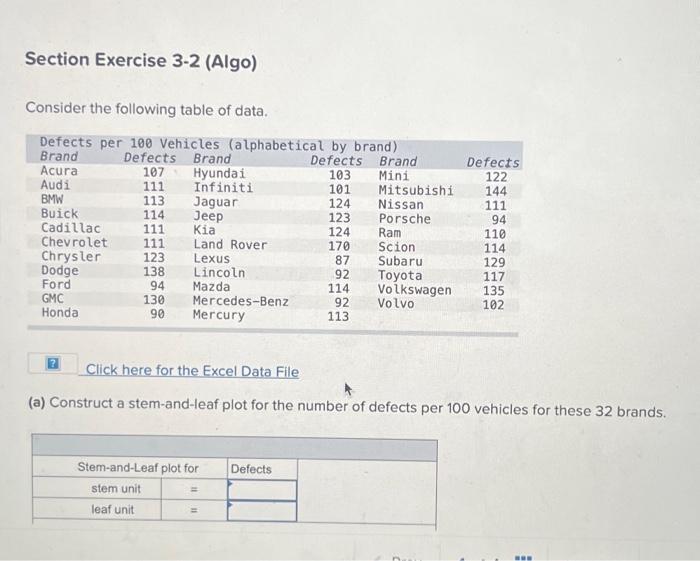
Section Exercise 3-2 (Algo) Consider the following table of data. Click here for the Excel Data File (a) Construct a stem-and-leaf plot for the number of defects per 100 vehicles for these 32 brands
Step by Step Solution
There are 3 Steps involved in it
1 Expert Approved Answer
Step: 1 Unlock

Question Has Been Solved by an Expert!
Get step-by-step solutions from verified subject matter experts
Step: 2 Unlock
Step: 3 Unlock