

Question: Section I. The following digraph represents a network flow problem with values at nodes showing net demand. a . Verify that total supply exceeds total
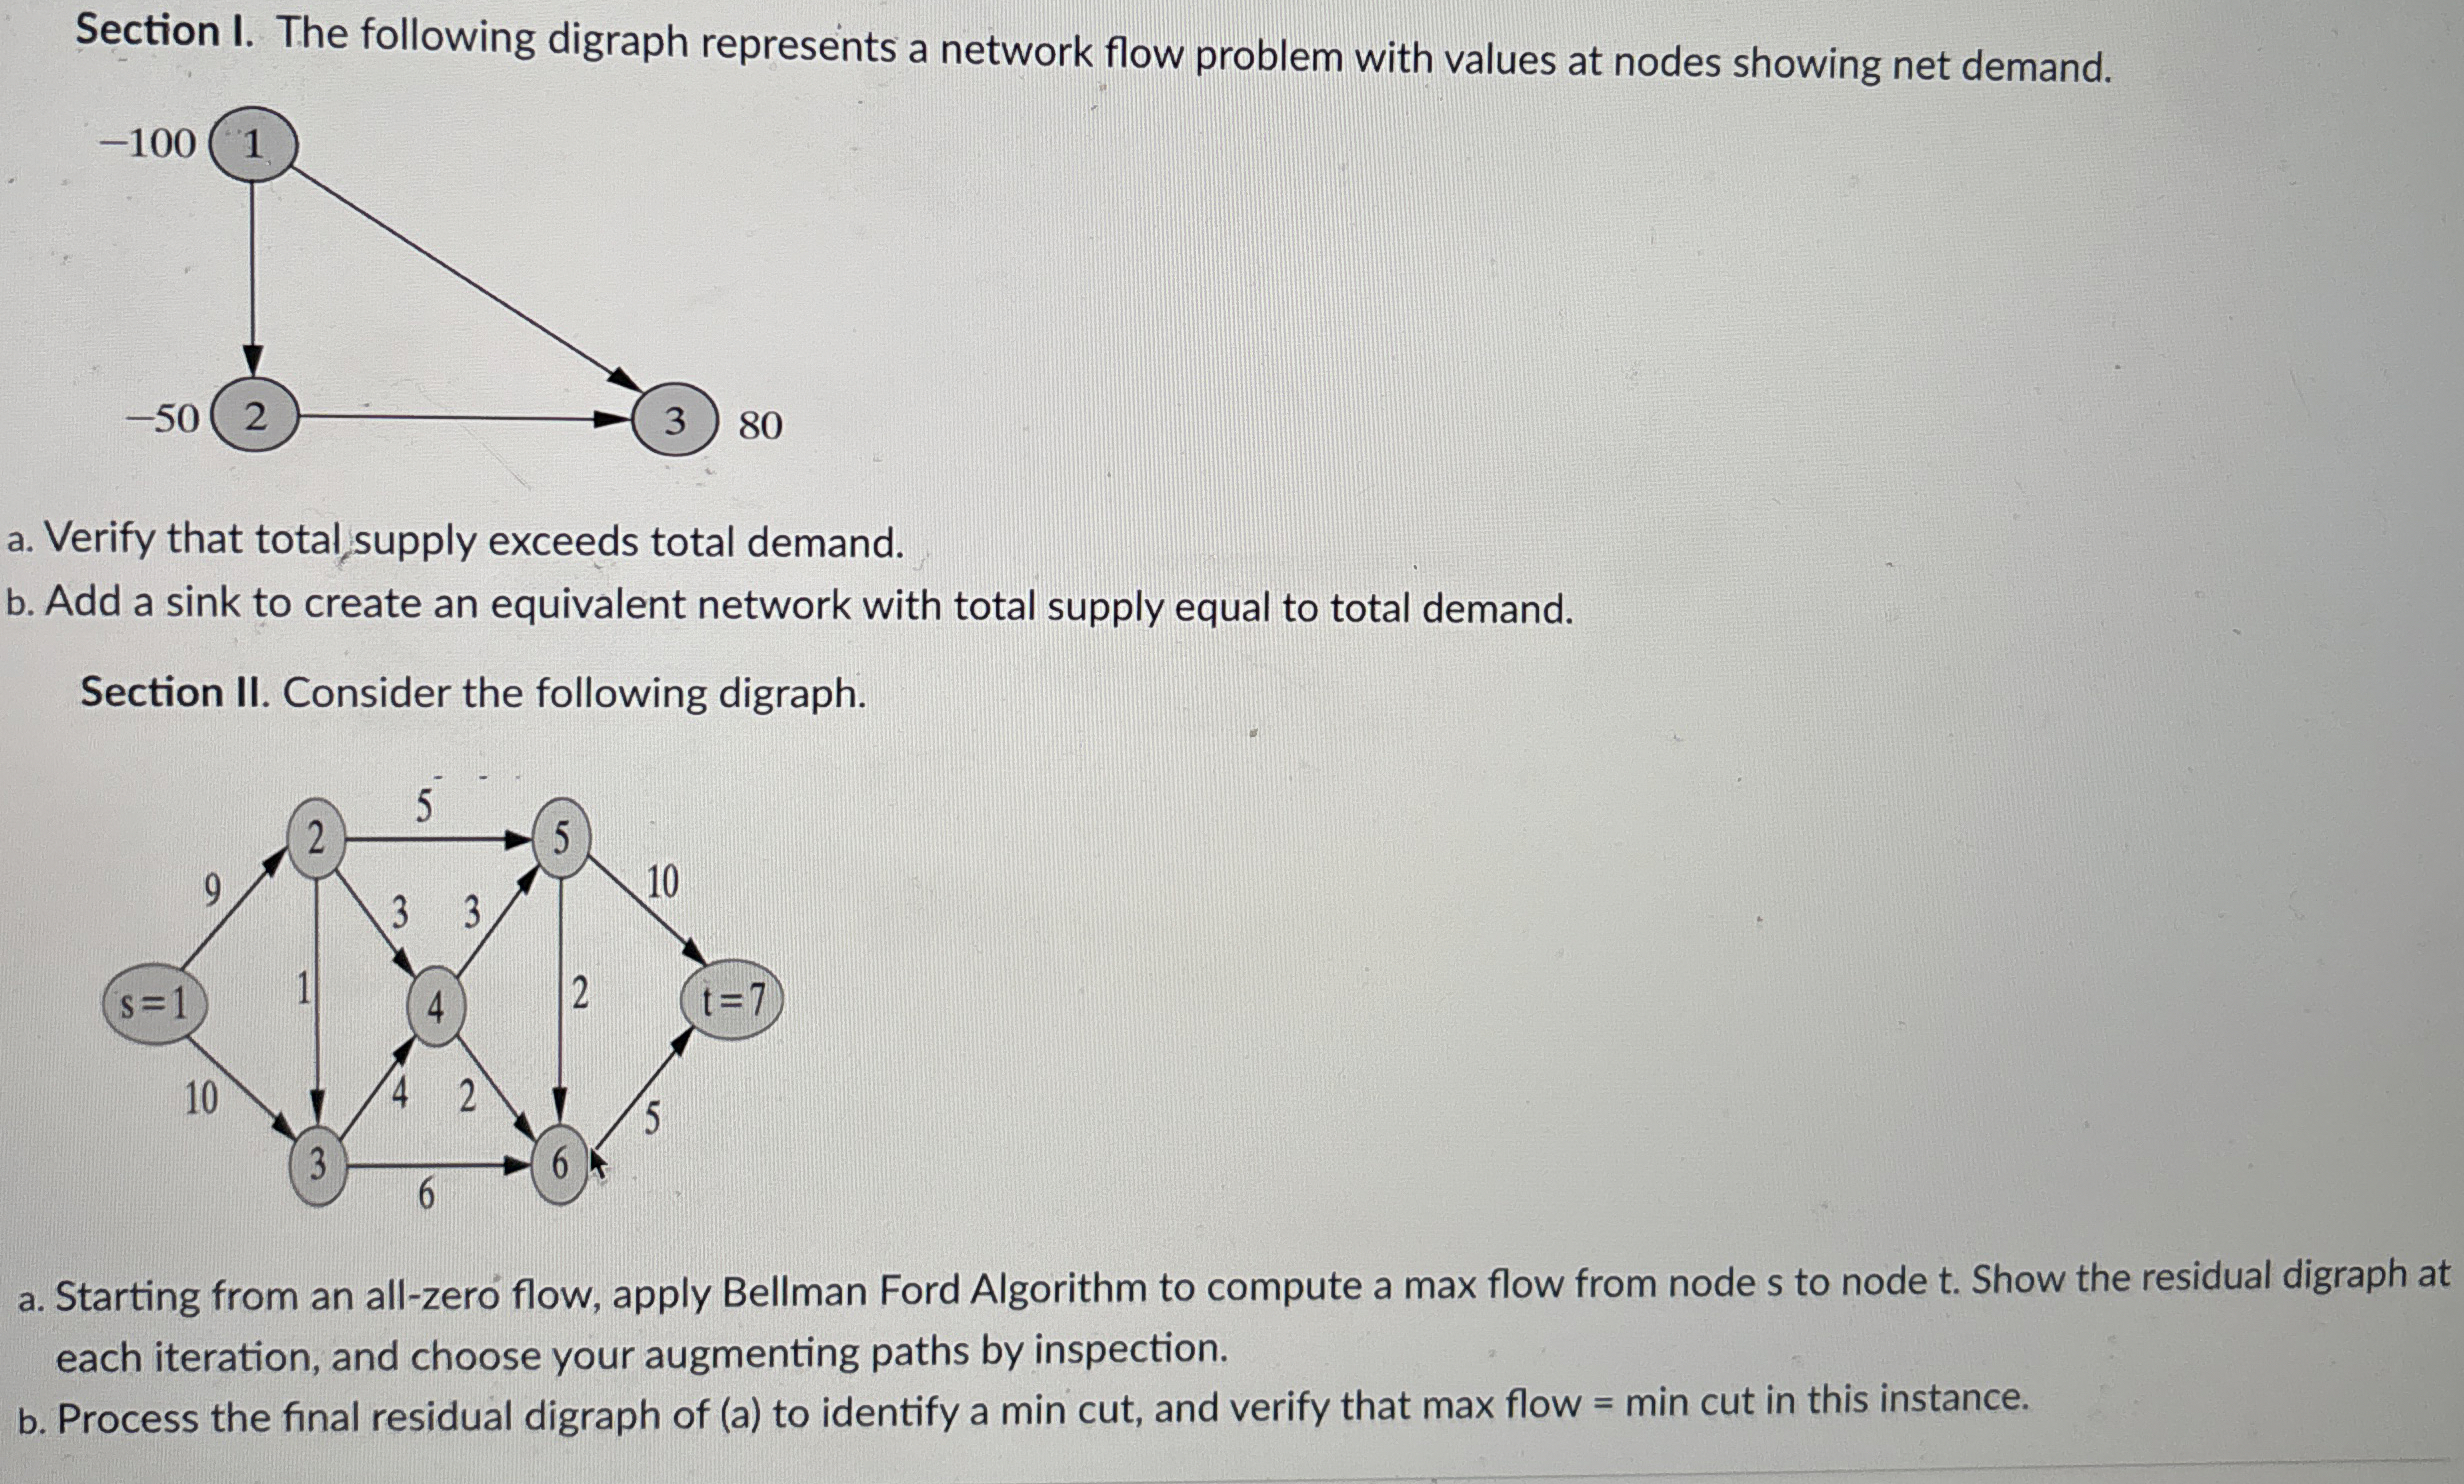
Section I. The following digraph represents a network flow problem with values at nodes showing net demand.
a Verify that total supply exceeds total demand.
b Add a sink to create an equivalent network with total supply equal to total demand.
Section II Consider the following digraph.
a Starting from an allzero flow, apply Bellman Ford Algorithm to compute a max flow from node to node Show the residual digraph at each iteration, and choose your augmenting paths by inspection.
b Process the final residual digraph of a to identify a min cut, and verify that max flow min cut in this instance.
Step by Step Solution
There are 3 Steps involved in it
1 Expert Approved Answer
Step: 1 Unlock

Question Has Been Solved by an Expert!
Get step-by-step solutions from verified subject matter experts
Step: 2 Unlock
Step: 3 Unlock