

Question: Can you please show me how this problem with drawings Section I. The following digraph represents a network flow problem with values at nodes showing
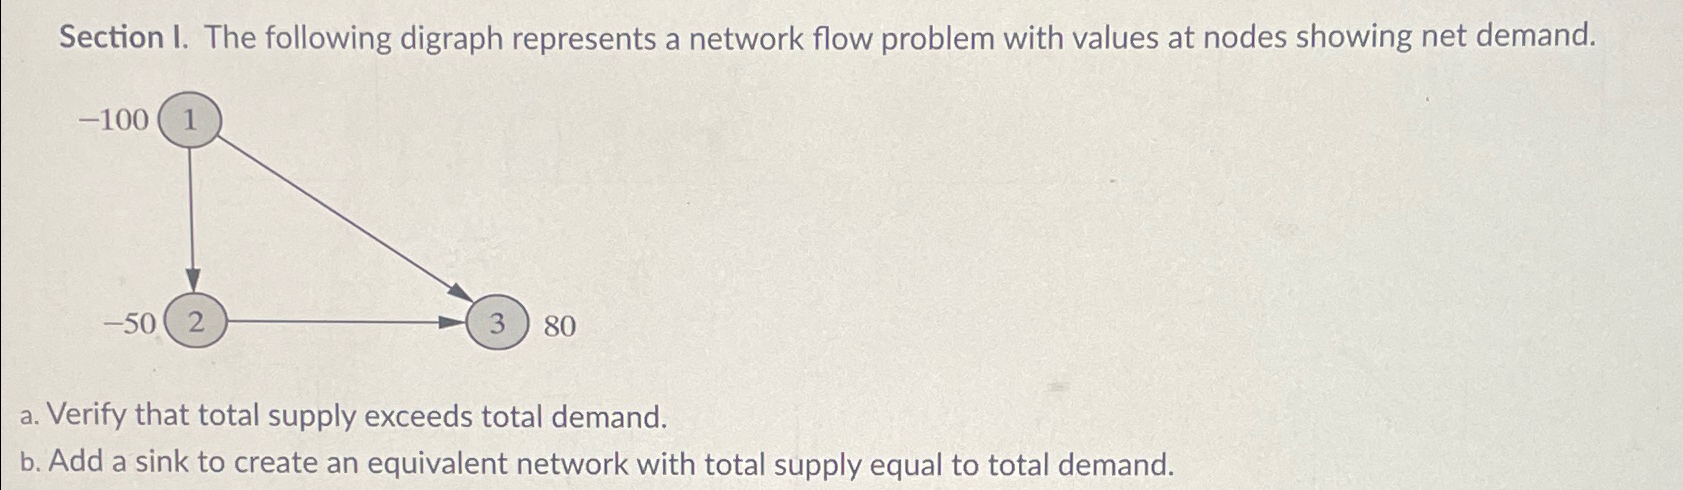
Can you please show me how this problem with drawings Section I. The following digraph represents a network flow problem with values at nodes showing net demand.
a Verify that total supply exceeds total demand.
b Add a sink to create an equivalent network with total supply equal to total demand.
Step by Step Solution
There are 3 Steps involved in it
1 Expert Approved Answer
Step: 1 Unlock

Question Has Been Solved by an Expert!
Get step-by-step solutions from verified subject matter experts
Step: 2 Unlock
Step: 3 Unlock