

Question: Security 1 8% 13% 18% Security 2 9% .15 .1 .05 11% .1 .2 .1 13% .05 .1 .15 a) Compute the expected returns and
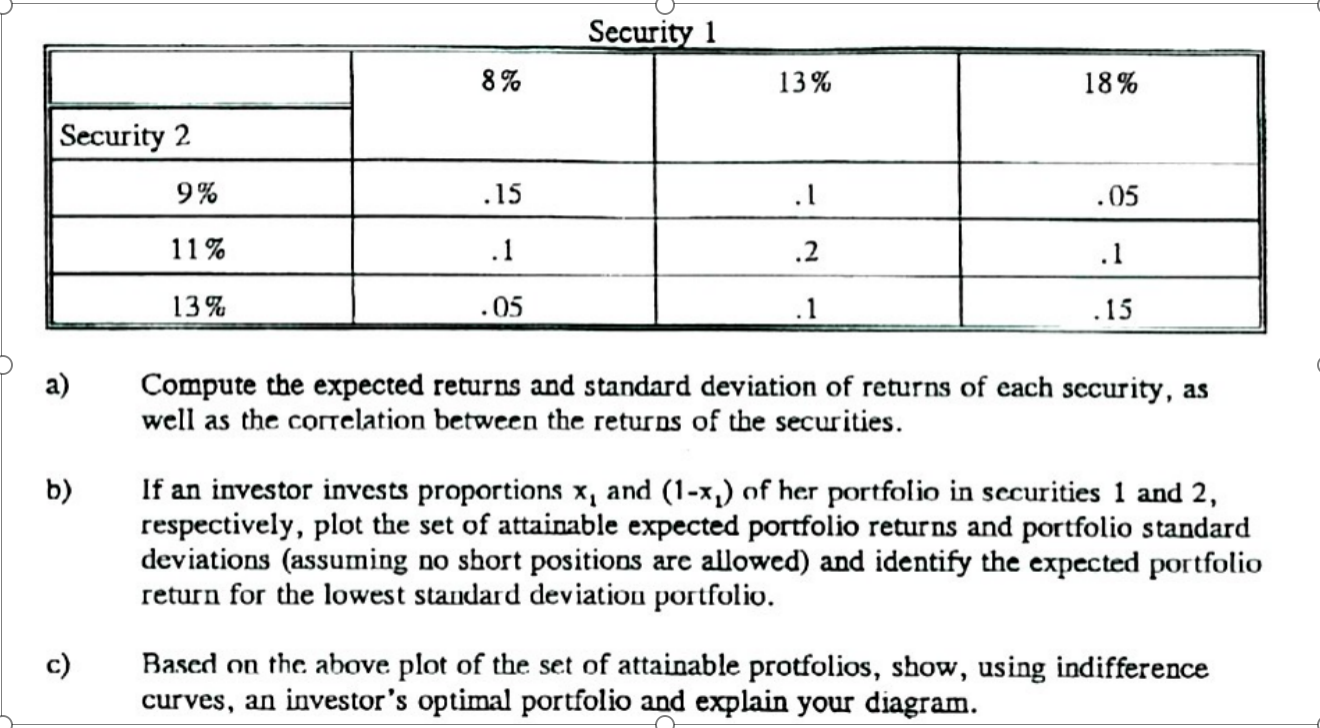
Security 1 8% 13% 18% Security 2 9% .15 .1 .05 11% .1 .2 .1 13% .05 .1 .15 a) Compute the expected returns and standard deviation of returns of each security, as well as the correlation between the returns of the securities. b) If an investor invests proportions x, and (1-x) of her portfolio in securities 1 and 2, respectively, plot the set of attainable expected portfolio returns and portfolio standard deviations (assuming no short positions are allowed) and identify the expected portfolio return for the lowest standard deviation portfolio. c) Based on the above plot of the set of attainable protfolios, show, using indifference curves, an investor's optimal portfolio and explain your diagram. Security 1 8% 13% 18% Security 2 9% .15 .1 .05 11% .1 .2 .1 13% .05 .1 .15 a) Compute the expected returns and standard deviation of returns of each security, as well as the correlation between the returns of the securities. b) If an investor invests proportions x, and (1-x) of her portfolio in securities 1 and 2, respectively, plot the set of attainable expected portfolio returns and portfolio standard deviations (assuming no short positions are allowed) and identify the expected portfolio return for the lowest standard deviation portfolio. c) Based on the above plot of the set of attainable protfolios, show, using indifference curves, an investor's optimal portfolio and explain your diagram
Step by Step Solution
There are 3 Steps involved in it

Get step-by-step solutions from verified subject matter experts