

Question: See excel spreadsheet below. 1. Calculate the 5 number summary for both sections as well as the overall score (both sections combined) 2. Calculate the
See excel spreadsheet below.
1. Calculate the 5 number summary for both sections as well as the overall score (both sections combined)
2. Calculate the mean for both sections as well as the overall score (both combined)
Both classes combined (all scores): 5 number summary, mean
3. Create at least 1 histogram. The histogram should display scores from both sections combined.
4. Create a probability distribution using all of the scores combined. What is the probabilityof getting A, B, C, D or F?
5. Next, Explain your findings and interpretation of the datain a manner that would be useful for students and the instructor (i.e. what should students and the instructor take away from this data?)
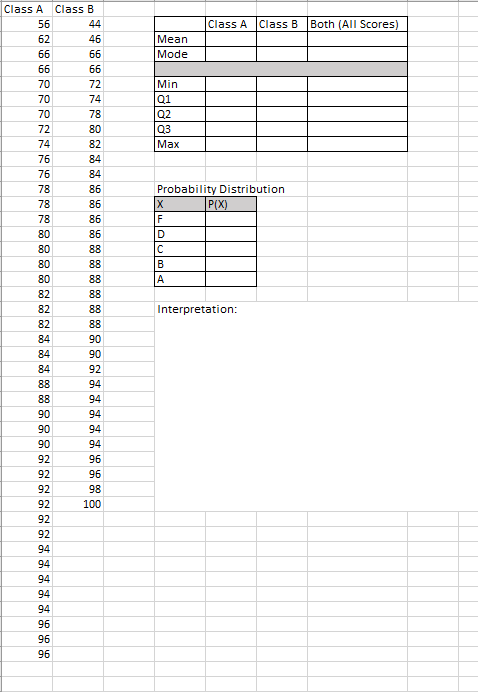
Class A Class B 56 44 Class A Class B Both (All Scores) 62 46 Mean 66 66 Mode 66 66 70 72 Min 70 74 01 70 78 02 72 80 Q3 74 82 Max 76 84 76 84 78 86 Probability Distribution 78 86 X P(X) 78 86 F 80 86 D 80 88 C 80 88 B 80 88 A 82 88 82 88 Interpretation: 82 88 84 90 84 90 84 92 88 94 88 94 90 94 90 94 90 94 92 96 92 96 92 98 92 100 92 92 94 94 94 94 94 96 96 96
Step by Step Solution
There are 3 Steps involved in it

Get step-by-step solutions from verified subject matter experts