

Question: See question attached. E 9 rmance Control at Happy Chips, Inc. orthmann, manager of logistics cost analysis for Happy Chips, Inc., was fac cult task.
See question attached.
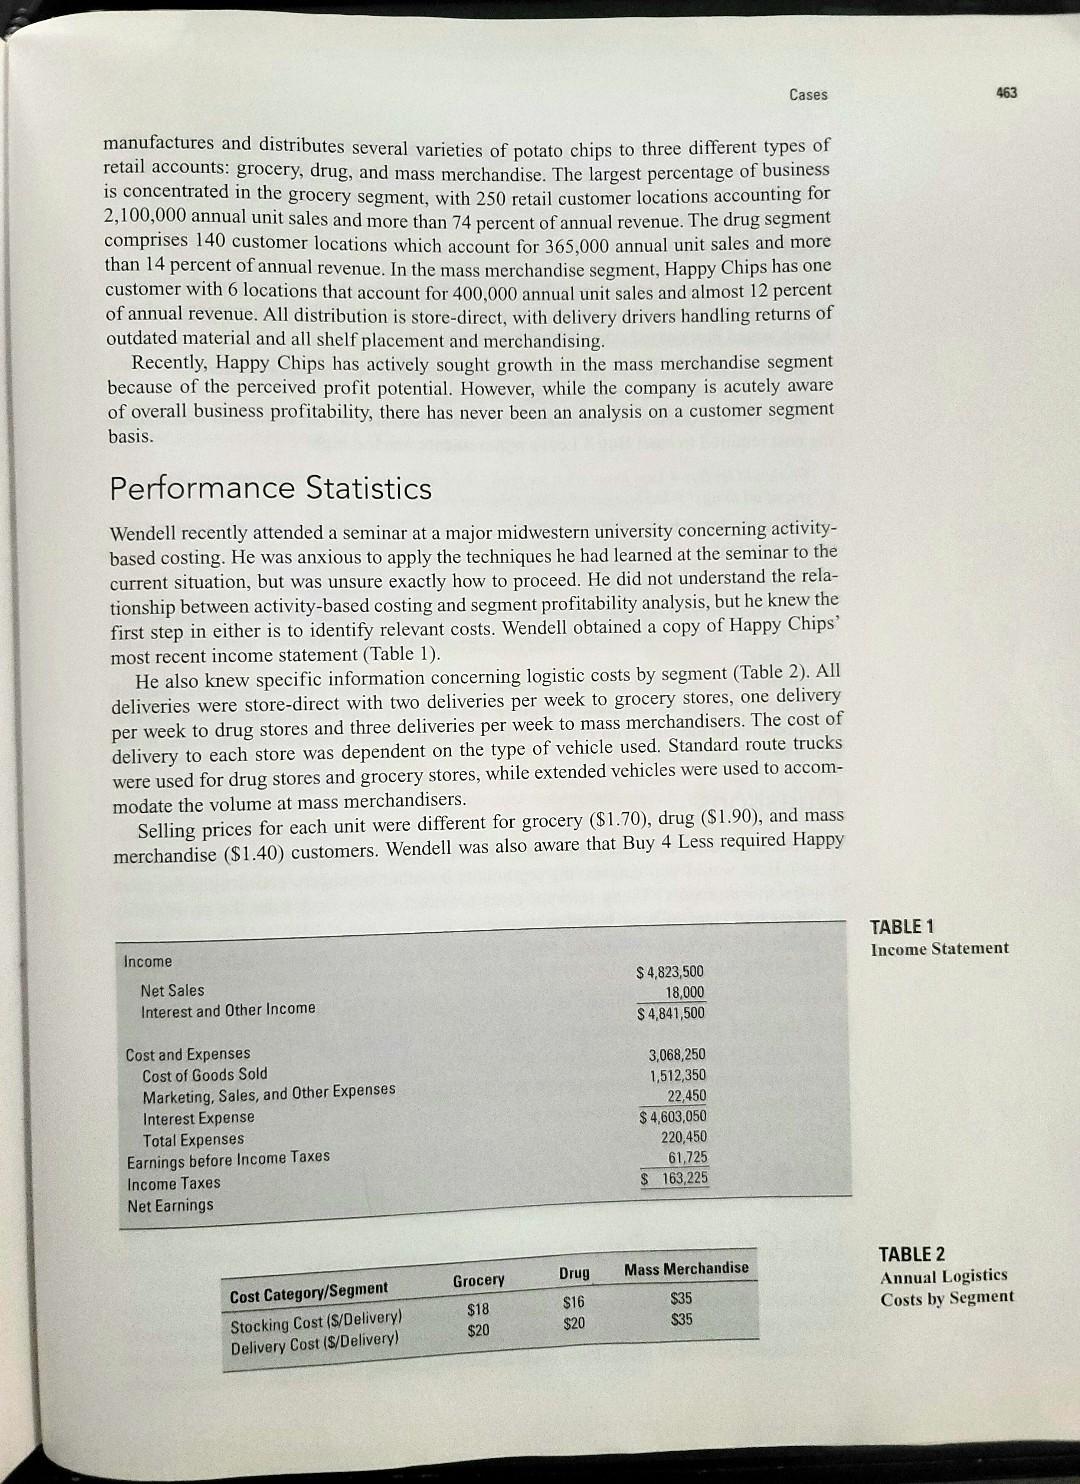
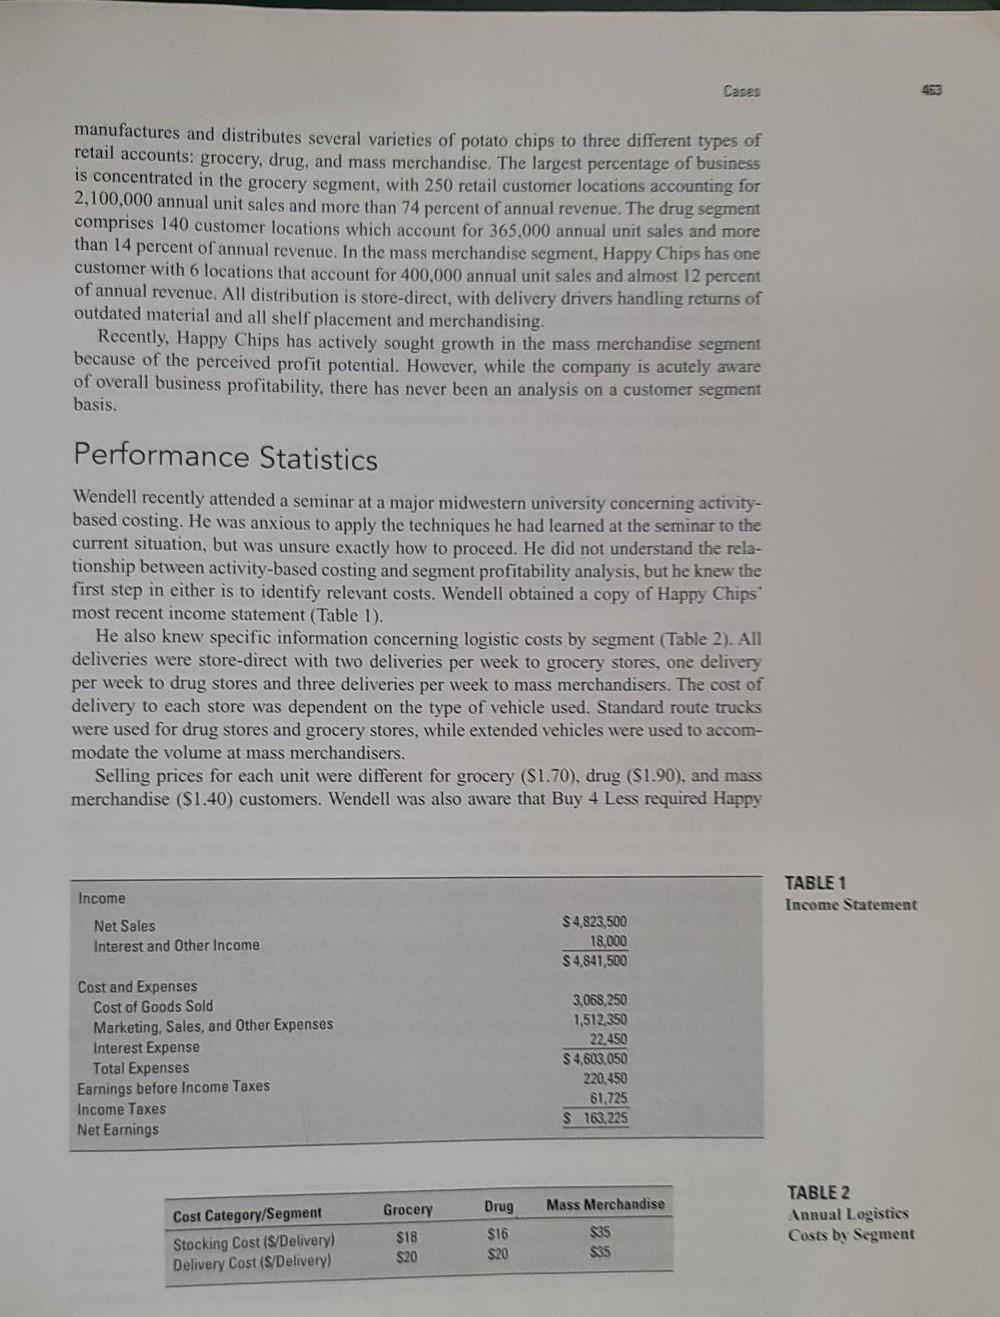
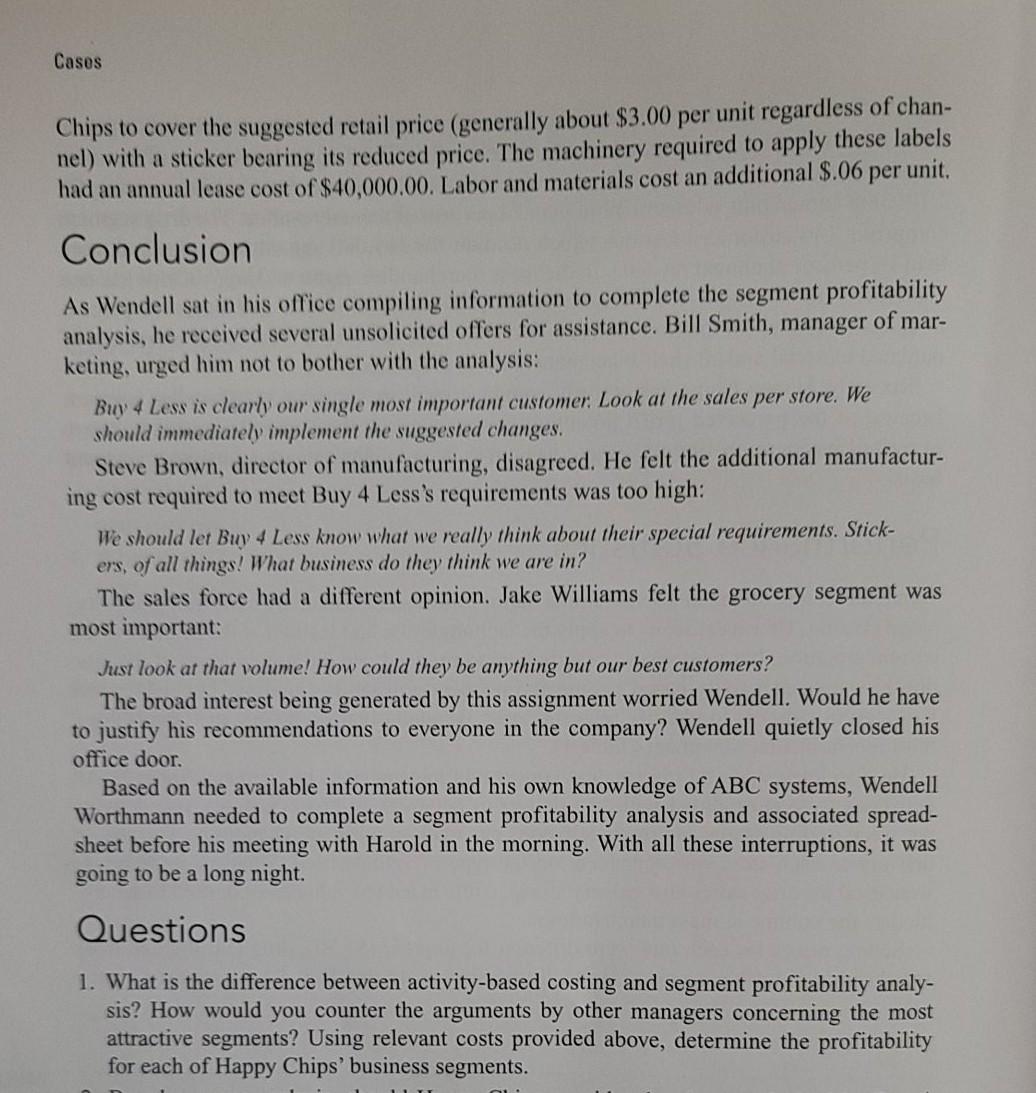
E 9 rmance Control at Happy Chips, Inc. orthmann, manager of logistics cost analysis for Happy Chips, Inc., was fac cult task. Harold L. Carter, the new director of logistics had circulated a let y Chips' only mass merchandise customer, Buy 4 Less, complaining of pa erformance. Among the problems cited by Buy 4 Less were: (1) frequent sto or customer service responsiveness and (3) high prices for Happy Chips' pre tter suggested that if Happy Chips were to remain a supplier to Buy 4 Less to eliminate stockouts by: (1) providing direct store delivery four times ad of three); (2) installing an automated order inquiry system to increase c ce responsiveness ($300,000 investment); and (3) decreasing product prices While the previous director of logistics would most certainly have begun imp = suggested changes, Harold Carter was different. He requested that Wend tailed analysis of Happy Chips' profitability by segment. He also asked tha on a spreadsheet to permit some basic analysis. This was something that W er previously attempted, and it was needed first thing in the morning. any Background s, Inc., is the fifth largest potato chip manufacturer in the metropoli ket. The company was founded in 1922 and following an unsuccessful atter expansion has remained primarily a local operation. The company currer Cases 463 manufactures and distributes several varieties of potato chips to three different types of retail accounts: grocery, drug, and mass merchandise. The largest percentage of business is concentrated in the grocery segment, with 250 retail customer locations accounting for 2,100,000 annual unit sales and more than 74 percent of annual revenue. The drug segment comprises 140 customer locations which account for 365,000 annual unit sales and more than 14 percent of annual revenue. In the mass merchandise segment, Happy Chips has one customer with 6 locations that account for 400,000 annual unit sales and almost 12 percent of annual revenue. All distribution is store-direct, with delivery drivers handling returns of outdated material and all shelf placement and merchandising. Recently, Happy Chips has actively sought growth in the mass merchandise segment because of the perceived profit potential. However, while the company is acutely aware of overall business profitability, there has never been an analysis on a customer segment basis. Performance Statistics Wendell recently attended a seminar at a major midwestern university concerning activity- based costing. He was anxious to apply the techniques he had learned at the seminar to the current situation, but was unsure exactly how to proceed. He did not understand the rela- tionship between activity-based costing and segment profitability analysis, but he knew the first step in either is to identify relevant costs. Wendell obtained a copy of Happy Chips' most recent income statement (Table 1). He also knew specific information concerning logistic costs by segment (Table 2). All deliveries were store-direct with two deliveries per week to grocery stores, one delivery per week to drug stores and three deliveries per week to mass merchandisers. The cost of delivery to each store was dependent on the type of vehicle used. Standard route trucks were used for drug stores and grocery stores, while extended vehicles were used to accom- modate the volume at mass merchandisers. Selling prices for each unit were different for grocery ($1.70), drug ($1.90), and mass merchandise ($1.40) customers. Wendell was also aware that Buy 4 Less required Happy TABLE 1 Income Statement Income Net Sales Interest and Other Income $ 4,823,500 18,000 $ 4,841,500 Cost and Expenses Cost of Goods Sold Marketing, Sales, and Other Expenses Interest Expense Total Expenses Earnings before Income Taxes Income Taxes Net Earnings 3,068,250 1,512,350 22,450 $4,603,050 220,450 61,725 $ 163,225 Mass Merchandise Grocery $18 $20 Cost Category/Segment Stocking Cost (S/Delivery) Delivery Cost (S/Delivery) TABLE 2 Annual Logistics Costs by Segment Drug $16 $20 $35 $35 Cases Chips to cover the suggested retail price (generally about $3.00 per unit regardless nel) with a sticker bearing its reduced price. The machinery required to apply th had an annual lease cost of $40,000.00. Labor and materials cost an additional $.06 Conclusion As Wendell sat in his office compiling information to complete the segment pro analysis, he received several unsolicited offers for assistance. Bill Smith, manage keting, urged him not to bother with the analysis: Buy 4 Less is clearly our single most important customer. Look at the sales per store. should immediately implement the suggested changes. Steve Brown, director of manufacturing, disagreed. He felt the additional ma ing cost required to meet Buy 4 Less's requirements was too high: We should let Buy 4 Less know what we really think about their special requirements. ers, of all things! What business do they think we are in? The sales force had a different opinion. Jake Williams felt the grocery seg most important: Just look at th volume! How could they be anything but our best customers? The broad interest being generated by this assignment worried Wendell. Woul to justify his recommendations to everyone in the company? Wendell quietly office door. Based on the available information and his own knowledge of ABC systems Worthmann needed to complete a segment profitability analysis and associate sheet before his meeting with Harold in the morning. With all these interruptio going to be a long night. Questions 1. What is the difference between activity-based costing and segment profitabil sis? How would you counter the arguments by other managers concerning attractive segments? Using relevant costs provided above, determine the pro for each of Happy Chips' business segments. Performance Control at Happy Chips, Inc. Wendell Worthmann, manager of logistics cost analysis for Happy Chips, Inc., was faced with a difficult task. Harold L. Carter, the new director of logistics had circulated a letter from Happy Chips' only mass merchandise customer, Buy 4 Less, complaining of poor operating performance. Among the problems cited by Buy 4 Less were: (1) frequent stock- outs (2) poor customer service responsiveness and (3) high prices for Happy Chips' prod- ucts. The letter suggested that if Happy Chips were to remain a supplier to Buy 4 Less, it would need to eliminate stockouts by: (1) providing direct store delivery four times per week (instead of three); (2) installing an automated order inquiry system to increase cus- tomer service responsiveness ($300,000 investment); and (3) decreasing product prices by 5 percent. While the previous director of logistics would most certainly have begun imple- menting the suggested changes, Harold Carter was different. He requested that Wendell prepare a detailed analysis of Happy Chips' profitability by segment. He also asked that it be prepared on a spreadsheet to permit some basic analysis. This was something that Wen- dell had never previously attempted, and it was needed first thing in the morning. Company Background Happy Chips, Inc., is the fifth largest potato chip manufacturer in the metropolitan Detroit market. The company was founded in 1922 and following an unsuccessful attempt at national expansion has remained primarily a local operation. The company currently Cases 493 manufactures and distributes several varieties of potato chips to three different types of retail accounts: grocery, drug, and mass merchandise. The largest percentage of business is concentrated in the grocery segment, with 250 retail customer locations accounting for 2,100,000 annual unit sales and more than 74 percent of annual revenue. The drug segment comprises 140 customer locations which account for 365,000 annual unit sales and more than 14 percent of annual revenue. In the mass merchandise segment, Happy Chips has one customer with 6 locations that account for 400.000 annual unit sales and almost 12 percent of annual revenue. All distribution is store-direct, with delivery drivers handling returns of outdated material and all shelf placement and merchandising. Recently, Happy Chips has actively sought growth in the mass merchandise segment because of the perceived profit potential. However, while the company is acutely aware of overall business profitability, there has never been an analysis on a customer segment basis. Performance Statistics Wendell recently attended a seminar at a major midwestern university concerning activity- based costing. He was anxious to apply the techniques he had learned at the seminar to the current situation, but was unsure exactly how to proceed. He did not understand the rela- tionship between activity-based costing and segment profitability analysis, but he knew the first step in either is to identify relevant costs. Wendell obtained a copy of Happy Chips most recent income statement (Table 1). He also knew specific information concerning logistic costs by segment (Table 2). All deliveries were store-direct with two deliveries per week to grocery stores, one delivery per week to drug stores and three deliveries per week to mass merchandisers. The cost of delivery to each store was dependent on the type of vehicle used. Standard route trucks were used for drug stores and grocery stores, while extended vehicles were used to accom- modate the volume at mass merchandisers. Selling prices for each unit were different for grocery ($1.70), drug (51.90), and mass merchandise ($1.40) customers. Wendell was also aware that Buy 4 Less required Happy Income TABLE 1 Income Statement Net Sales Interest and Other Income $4,823,500 18,000 $4.841,500 Cost and Expenses Cost of Goods Sold Marketing, Sales, and Other Expenses Interest Expense Total Expenses Earnings before Income Taxes Income Taxes Net Earnings 3,068,250 1,512 350 22,450 $4,603,050 220.450 61,725 S 163,225 Grocery Mass Merchandise Cost Category/Segment Stocking Cost (S/Delivery) Delivery Cost (S/Delivery) TABLE 2 Annual Logistics Costs by Segment Drug $16 S20 S18 S20 $35 $35 Cases Chips to cover the suggested retail price (generally about $3.00 per unit regardless of chan- nel) with a sticker bearing its reduced price. The machinery required to apply these labels had an annual lease cost of $40,000.00. Labor and materials cost an additional $.06 per unit. Conclusion As Wendell sat in his office compiling information to complete the segment profitability analysis, he received several unsolicited offers for assistance. Bill Smith, manager of mar- keting, urged him not to bother with the analysis: Buy 4 Less is clearly our single most important customer. Look at the sales per store. We should immediately implement the suggested changes. Steve Brown, director of manufacturing, disagreed. He felt the additional manufactur- ing cost required to meet Buy 4 Less's requirements was too high: We should let Buy 4 Less know what we really think about their special requirements. Stick- ers, of all things! What business do they think we are in? The sales force had a different opinion. Jake Williams felt the grocery segment was most important: Just look at that volume! How could they be anything but our best customers? The broad interest being generated by this assignment worried Wendell. Would he have to justify his recommendations to everyone in the company? Wendell quietly closed his office door. Based on the available information and his own knowledge of ABC systems, Wendell Worthmann needed to complete a segment profitability analysis and associated spread- sheet before his meeting with Harold in the morning. With all these interruptions, it was going to be a long night. Questions 1. What is the difference between activity-based costing and segment profitability analy- sis? How would you counter the arguments by other managers concerning the most attractive segments? Using relevant costs provided above, determine the profitability for each of Happy Chips' business segments. Questions 1. What is the difference between activity-based costing and segment profitability analy- sis? How would you counter the arguments by other managers concerning the most attractive segments? Using relevant costs provided above, determine the profitability for each of Happy Chips' business segmentsStep by Step Solution
There are 3 Steps involved in it
1 Expert Approved Answer
Step: 1 Unlock

Question Has Been Solved by an Expert!
Get step-by-step solutions from verified subject matter experts
Step: 2 Unlock
Step: 3 Unlock