

Question: See screenshot '... ...,_ v .7. The table below lists measured amounts of redshift and the distances (billions of light-years) to randomly selected astronomical objects.
See screenshot
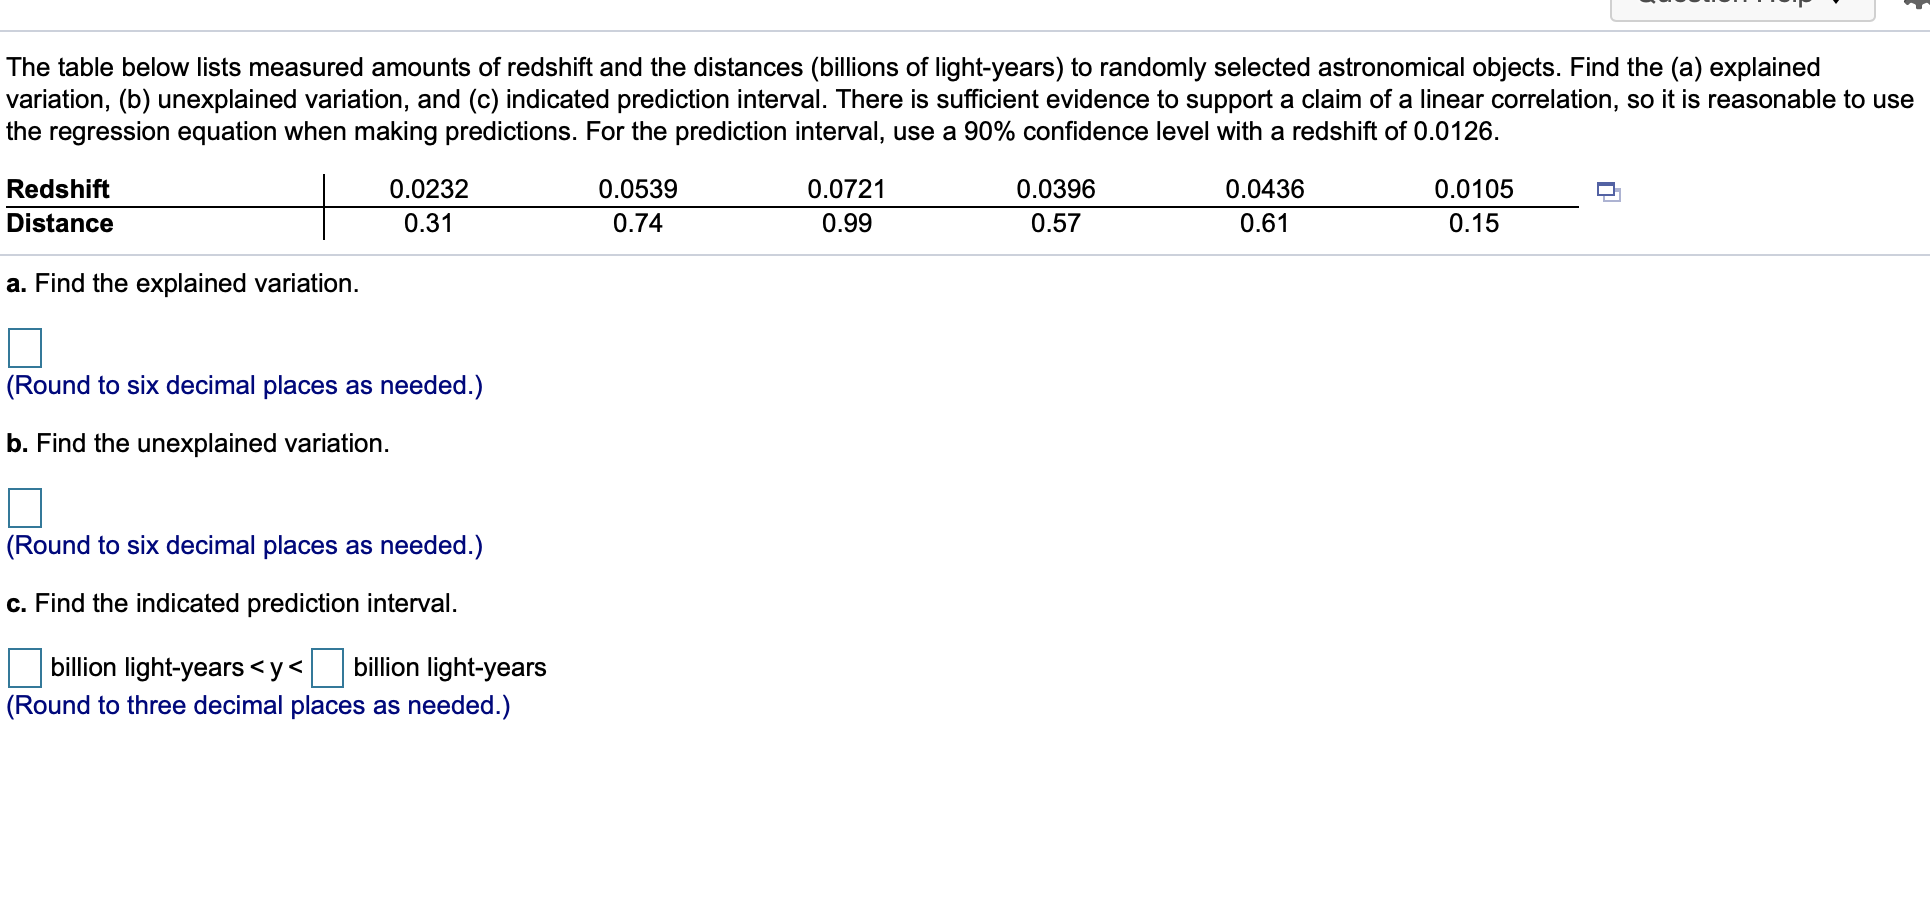
'... ...,_ v .7. The table below lists measured amounts of redshift and the distances (billions of light-years) to randomly selected astronomical objects. Find the (a) explained variation, (b) unexplained variation, and (c) indicated prediction interval. There is sufcient evidence to support a claim of a linear correlation, so it is reasonable to use the regression equation when making predictions. For the prediction interval, use a 90% confidence level with a redshift of 0.0126. Redshift 0.0232 0.0539 0.0721 0.0396 0.0436 0.0105 g: Distance 0.31 0.74 0.99 0.57 0.61 0.15 a. Find the explained variation. |:| (Round to six decimal places as needed.) b. Find the unexplained variation. |:| (Round to six decimal places as needed.) c. Find the indicated prediction interval. |:| billion light-years
Step by Step Solution
There are 3 Steps involved in it

Get step-by-step solutions from verified subject matter experts