

Question: This test: 100 point(s) Test: Week 2 Test (10.1-10.5) Question 2 of 20 possible This question: 5 Submit test point(s) possible The table below lists
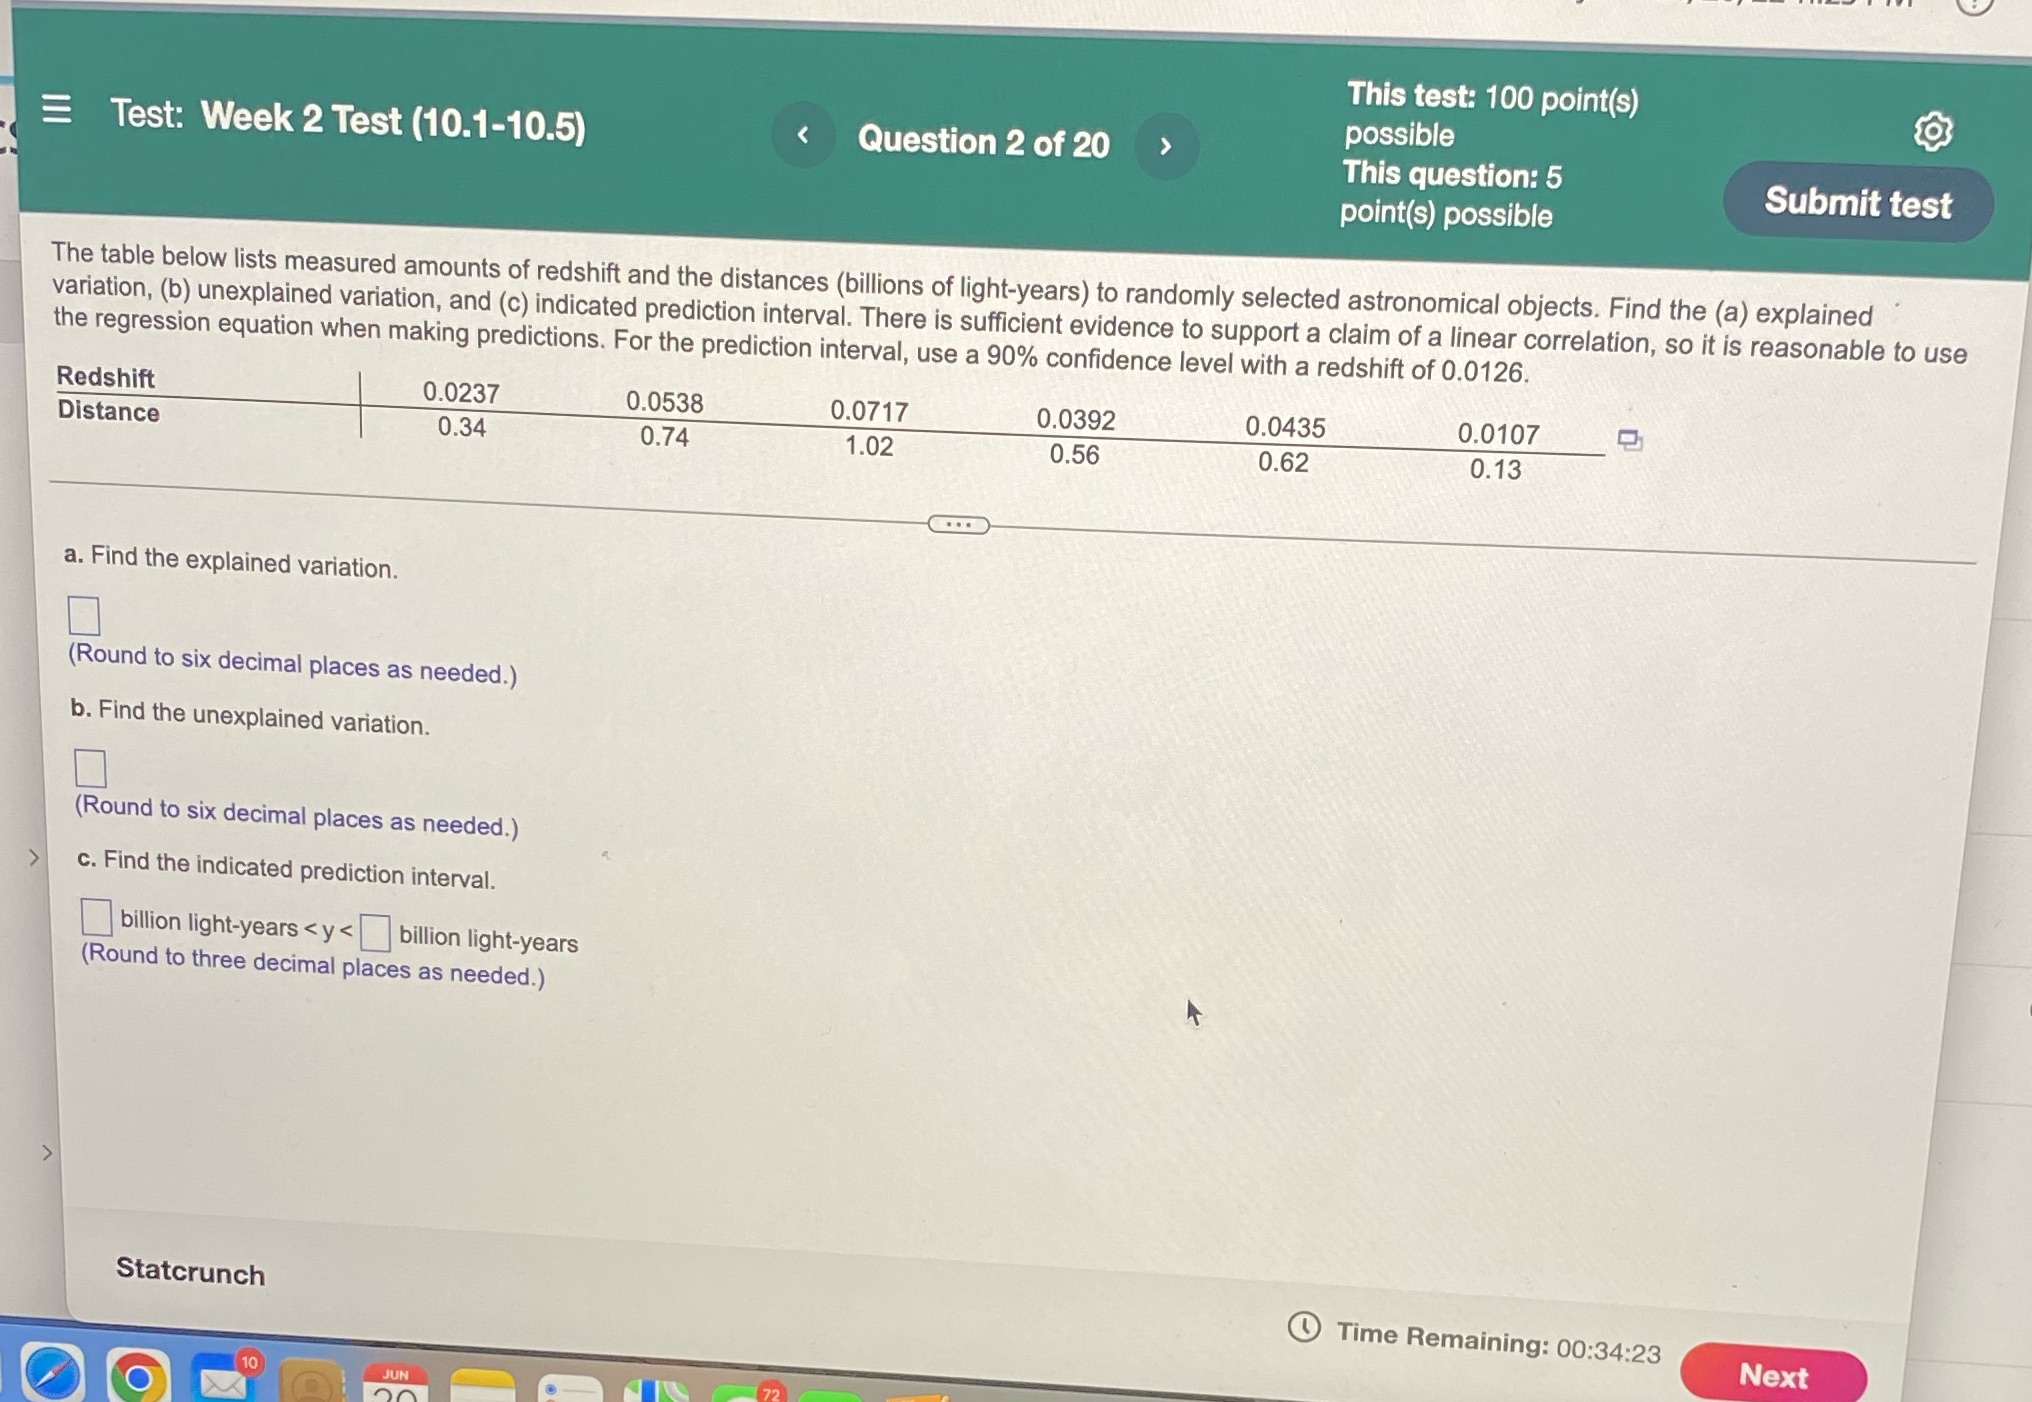
This test: 100 point(s) Test: Week 2 Test (10.1-10.5) Question 2 of 20 possible This question: 5 Submit test point(s) possible The table below lists measured amounts of redshift and the distances (billions of light-years) to randomly selected astronomical objects. Find the (a) explained variation, (b) unexplained variation, and (c) indicated prediction interval. There is sufficient evidence to support a claim of a linear correlation, so it is reasonable to use the regression equation when making predictions. For the prediction interval, use a 90% confidence level with a redshift of 0.0126. Redshift 0.0237 0.0538 0.0717 0.0392 0.0435 0.0107 Distance 0.34 0.74 1.02 0.56 0.62 0.13 a. Find the explained variation. Round to six decimal places as needed.) b. Find the unexplained variation. Round to six decimal places as needed.) c. Find the indicated prediction interval. billion light-years
Step by Step Solution
There are 3 Steps involved in it

Get step-by-step solutions from verified subject matter experts