

Question: See Table 2.5 5 showing financial statement data and stock price data for Mydeco Corp, a. How did Mydeco's accounts receivable days change over this
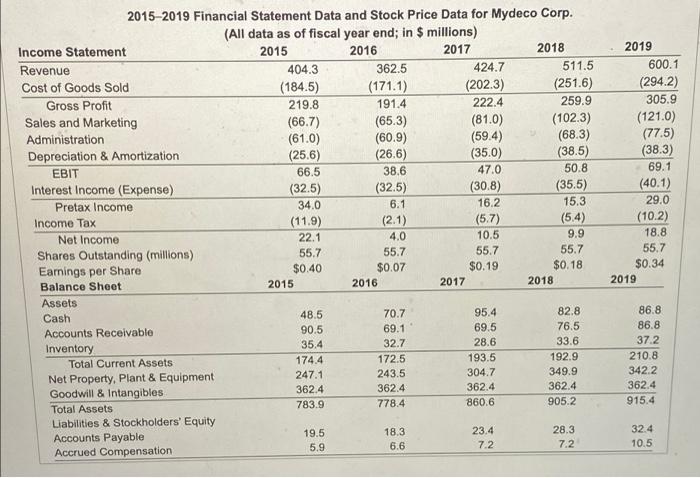
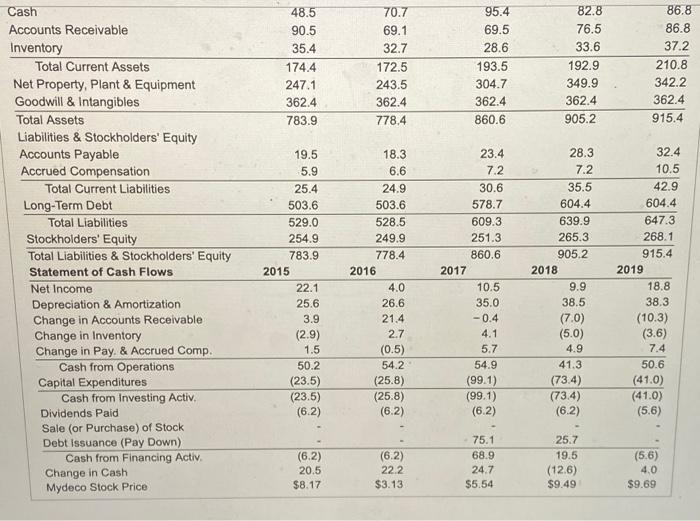
See Table 2.5 5 showing financial statement data and stock price data for Mydeco Corp, a. How did Mydeco's accounts receivable days change over this period? b. How did Mydeco's inventory days change over this period? c. Based on your analysis, has Mydeco improved its management of its working capital during this time period? (Note: Use a 365-day year.) GOOD a. How did Mydeco's accounts receivable days change over this period? The accounts receivable days for 2015 is days. (Round to one decimal place.) 2015-2019 Financial Statement Data and Stock Price Data for Mydeco Corp. (All data as of fiscal year end; in $ millions) Income Statement 2015 2016 2017 2018 Revenue 404.3 362.5 424.7 511.5 Cost of Goods Sold (184.5) (171.1) (202.3) (251.6) Gross Profit 219.8 191.4 222.4 259.9 Sales and Marketing (66.7) (65.3) (81.0) (102.3) Administration (61.0) (60.9) (59.4) (68.3) Depreciation & Amortization (25.6) (26.6) (35.0) (38.5) EBIT 66.5 38.6 47.0 50.8 Interest Income (Expense) (32.5) (32.5) (30.8) (35.5) Pretax Income 34.0 6.1 16.2 15.3 Income Tax (11.9) (2.1) (5.7) (5.4) Net Income 22.1 4.0 9.9 Shares Outstanding (millions) 55.7 55.7 55.7 55.7 Eamings per Share $0.40 $0.07 $0.19 $0.18 Balance Sheet 2015 2016 2017 2018 Assets Cash 48.5 70.7 95.4 82.8 Accounts Receivable 90.5 69.1 69.5 76.5 Inventory 35,4 32.7 28.6 33.6 Total Current Assets 174.4 172.5 193.5 192.9 247.1 Net Property, Plant & Equipment 243.5 304.7 349.9 Goodwill & Intangibles 362.4 362.4 362.4 362.4 Total Assets 783.9 778.4 860.6 905.2 Liabilities & Stockholders' Equity 19.5 Accounts Payable 18.3 23.4 28.3 5.9 Accrued Compensation 6.6 7.2 7.2 2019 600.1 (294.2) 305.9 (121.0) (77.5) (38.3) 69.1 (40.1) 29.0 (10.2) 18.8 55.7 $0.34 2019 10.5 86.8 86.8 37.2 210.8 342.2 362.4 915.4 32.4 10.5 48.5 90.5 35.4 174.4 247.1 362.4 783.9 70.7 69.1 32.7 172.5 243.5 362.4 778.4 95.4 69.5 28.6 193.5 304.7 362.4 860.6 82.8 76.5 33.6 192.9 349.9 362.4 905.2 86.8 86.8 37.2 210.8 342.2 362.4 915.4 Cash Accounts Receivable Inventory Total Current Assets Net Property, Plant & Equipment Goodwill & Intangibles Total Assets Liabilities & Stockholders' Equity Accounts Payable Accrued Compensation Total Current Liabilities Long-Term Debt Total Liabilities Stockholders' Equity Total Liabilities & Stockholders' Equity Statement of Cash Flows Net Income Depreciation & Amortization Change in Accounts Receivable Change in Inventory Change in Pay. & Accrued Comp. Cash from Operations Capital Expenditures Cash from Investing Activ. Dividends Paid Sale (or Purchase) of Stock Debt Issuance (Pay Down) Cash from Financing Activ Change in Cash Mydeco Stock Price 19.5 5.9 25.4 503.6 529.0 254.9 783.9 2015 22.1 25.6 3.9 (2.9) 1.5 50.2 (23.5) (23.5) (6.2) 18.3 6.6 24.9 503.6 528.5 249.9 778.4 2016 4.0 26.6 21.4 2.7 (0.5) 54.2 (25.8) (25.8) (6.2) 23.4 7.2 30.6 578.7 609.3 251.3 860.6 2017 10.5 35.0 -0.4 4.1 5.7 54.9 (99.1) (99.1) (6.2) 28.3 7.2 35.5 604.4 639.9 265.3 905.2 2018 9.9 38.5 (7.0) (5.0) 4.9 41.3 (73.4) (73.4) (6.2) 32.4 10.5 42.9 604.4 647.3 268.1 915.4 2019 18.8 38.3 (10.3) (3.6) 7.4 50.6 (41.0) (41.0) (5.6) (6.2) 20.5 $8.17 (6.2) 22.2. $3.13 75.1 68.9 24.7 $5.54 25.7 19.5 (12.6) $9.49 (5.6) 4.0 $9.69
Step by Step Solution
There are 3 Steps involved in it

Get step-by-step solutions from verified subject matter experts