

Question: See Table 2.5 5 showing financial statement data and stock price data for Mydeco Corp. a. Compute Mydeco's ROE each year from 2015 to 2019.
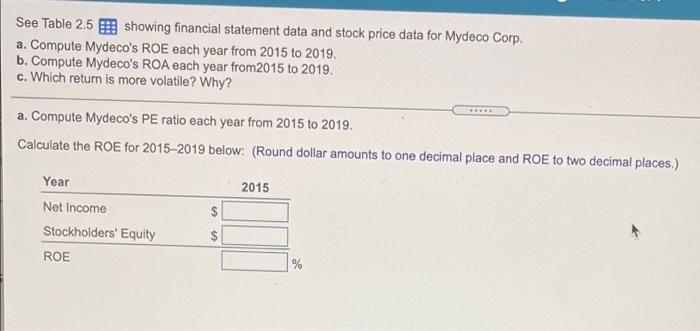
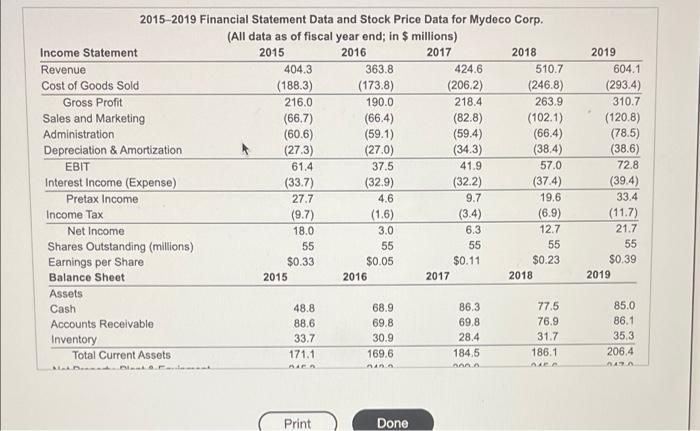
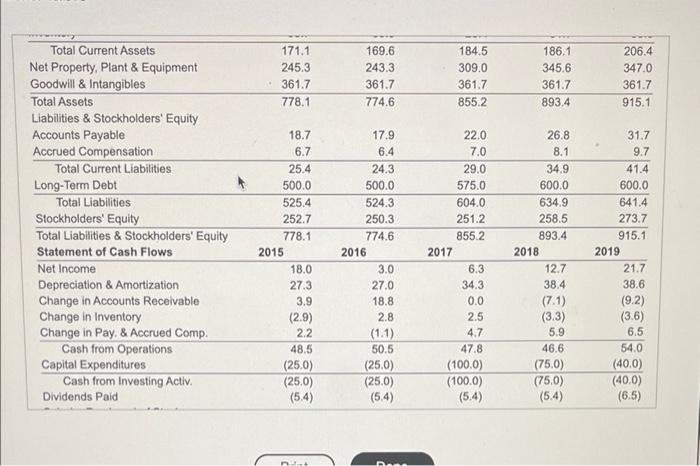
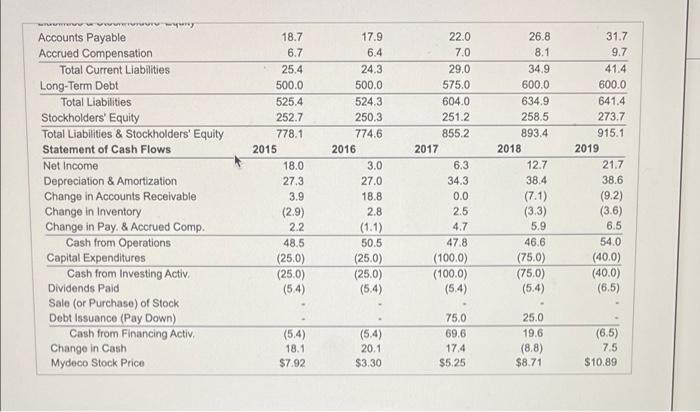
See Table 2.5 5 showing financial statement data and stock price data for Mydeco Corp. a. Compute Mydeco's ROE each year from 2015 to 2019. b. Compute Mydeco's ROA each year from 2015 to 2019. c. Which return is more volatile? Why? a. Compute Mydeco's PE ratio each year from 2015 to 2019. Calculate the ROE for 2015-2019 below: (Round dollar amounts to one decimal place and ROE to two decimal places.) 2015 Year Net Income Stockholders' Equity ROE $ $ % 2015-2019 Financial Statement Data and Stock Price Data for Mydeco Corp. (All data as of fiscal year end; in $ millions) Income Statement 2015 2016 2017 2018 Revenue 404.3 363.8 424.6 510.7 Cost of Goods Sold (188.3) (173.8) (206.2) (246.8) Gross Profit 216.0 190.0 218.4 263.9 Sales and Marketing (66.7) (66.4) (82.8) (1021) Administration (60.6) (59.1) (59.4) (66.4) Depreciation & Amortization (27.3) (27.0) (34.3) (38.4) EBIT 61.4 37.5 41.9 57.0 Interest Income (Expense) (33.7) (32.9) (32.2) (374) Pretax Income 27.7 4.6 9.7 19,6 Income Tax (9.7) (1.6) (3.4) (6.9) Net ome 18.0 3.0 6.3 12.7 Shares Outstanding (millions) 55 55 55 55 Earnings per Share $0.33 $0.05 $0.11 $0.23 Balance Sheet 2015 2016 2017 2018 Assets Cash 48.8 68.9 86.3 77.5 Accounts Receivable 88.6 69.8 76.9 Inventory 33.7 30.9 28.4 31.7 Total Current Assets 171.1 169.6 184,5 186.1 MDB 2019 604.1 (293.4) 310.7 (120.8) (78.5) (38.6) 72.8 (39.4) 33,4 (11.7) 21.7 55 $0.39 2019 69.8 85.0 86.1 35.3 206.4 MATA AE Print Done 171.1 245.3 361.7 778.1 169.6 243.3 361.7 774.6 184.5 309.0 361.7 186.1 345.6 361.7 893.4 206.4 347.0 361.7 915.1 855.2 Total Current Assets Net Property, Plant & Equipment Goodwill & Intangibles Total Assets Liabilities & Stockholders' Equity Accounts Payable Accrued Compensation Total Current Liabilities Long-Term Debt Total Liabilities Stockholders' Equity Total Liabilities & Stockholders' Equity Statement of Cash Flows Net Income Depreciation & Amortization Change in Accounts Receivable Change in Inventory Change in Pay. & Accrued Comp. Cash from Operations Capital Expenditures Cash from Investing Activ. Dividends Paid 18.7 6.7 25.4 500.0 525.4 252.7 778.1 2015 18.0 27.3 3.9 (2.9) 2.2 48.5 (25.0) (25.0) (5.4) 17.9 6.4 24.3 500.0 524.3 250.3 774.6 2016 3.0 27.0 18.8 2.8 22.0 7.0 29.0 575.0 604.0 251.2 855.2 2017 6.3 34.3 0.0 2.5 4.7 47.8 (100.0) (100.0) (5.4) 26.8 8.1 34.9 600.0 634.9 258.5 893.4 2018 12.7 38.4 (7.1) (3.3) 5.9 46.6 (75.0) (75.0) (5.4) 31.7 9.7 41.4 600.0 641.4 273.7 915.1 2019 21.7 38.6 (9.2) (3.6) 6.5 54.0 (40.0) (400) (6.5) 50.5 (25.0) (25.0) (5.4) DA wyway Accounts Payable Accrued Compensation Total Current Liabilities Long-Term Debt Total Liabilities Stockholders' Equity Total Liabilities & Stockholders' Equity Statement of Cash Flows Net Income Depreciation & Amortization Change in Accounts Receivable Change in Inventory Change in Pay. & Accrued Comp. Cash from Operations Capital Expenditures Cash from Investing Activ Dividends Paid Sale (or Purchase) of Stock Debt Issuance (Pay Down) Cash from Financing Activ, Change in Cash Mydeco Stock Price 18.7 6.7 25.4 500.0 525.4 252.7 778.1 2015 18.0 27.3 3.9 (2.9) 2.2 48.5 (25:0) (25.0) (5.4) 17.9 6.4 24.3 500.0 524.3 250.3 774.6 2016 3.0 27.0 18.8 2.8 (1.1) 50.5 (25.0) (25:0) (5.4) 22.0 7.0 29.0 575.0 604.0 251.2 855.2 2017 6.3 34.3 26.8 8.1 34.9 600.0 634.9 258.5 893.4 2018 12.7 38.4 (7.1) (3.3) 5.9 46.6 (75.0) (75,0) (5.4) 31.7 9.7 41.4 600.0 641.4 273.7 915.1 2019 21.7 38.6 (9.2) (3.6) 6.5 54.0 (40.0) (40.0) (6.5) 0.0 2.5 4.7 47.8 (1000) (100.0) (5.4) (5.4) 18.1 $7.92 (5.4) 20.1 $3.30 75,0 69,6 17.4 $5.25 25.0 19,6 (8.8) $8.71 (6.5) 75 $10.89
Step by Step Solution
There are 3 Steps involved in it

Get step-by-step solutions from verified subject matter experts