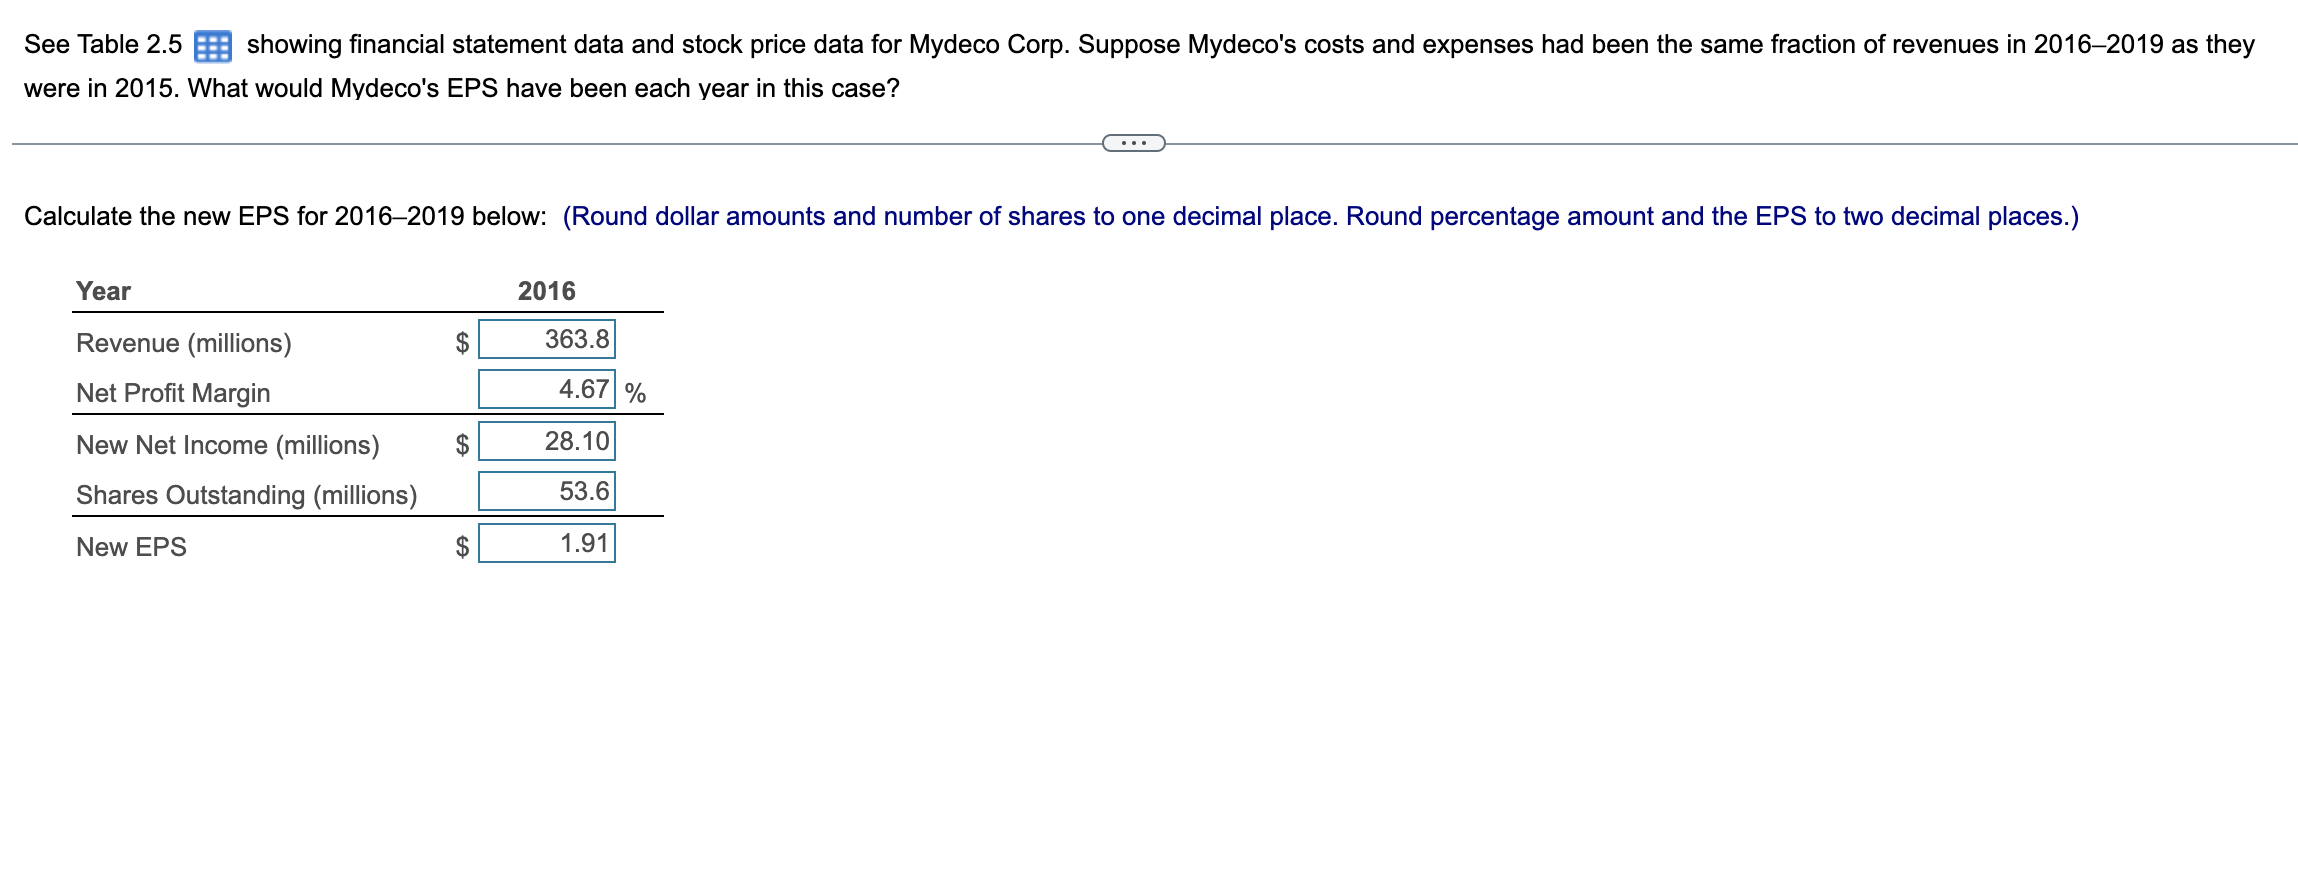
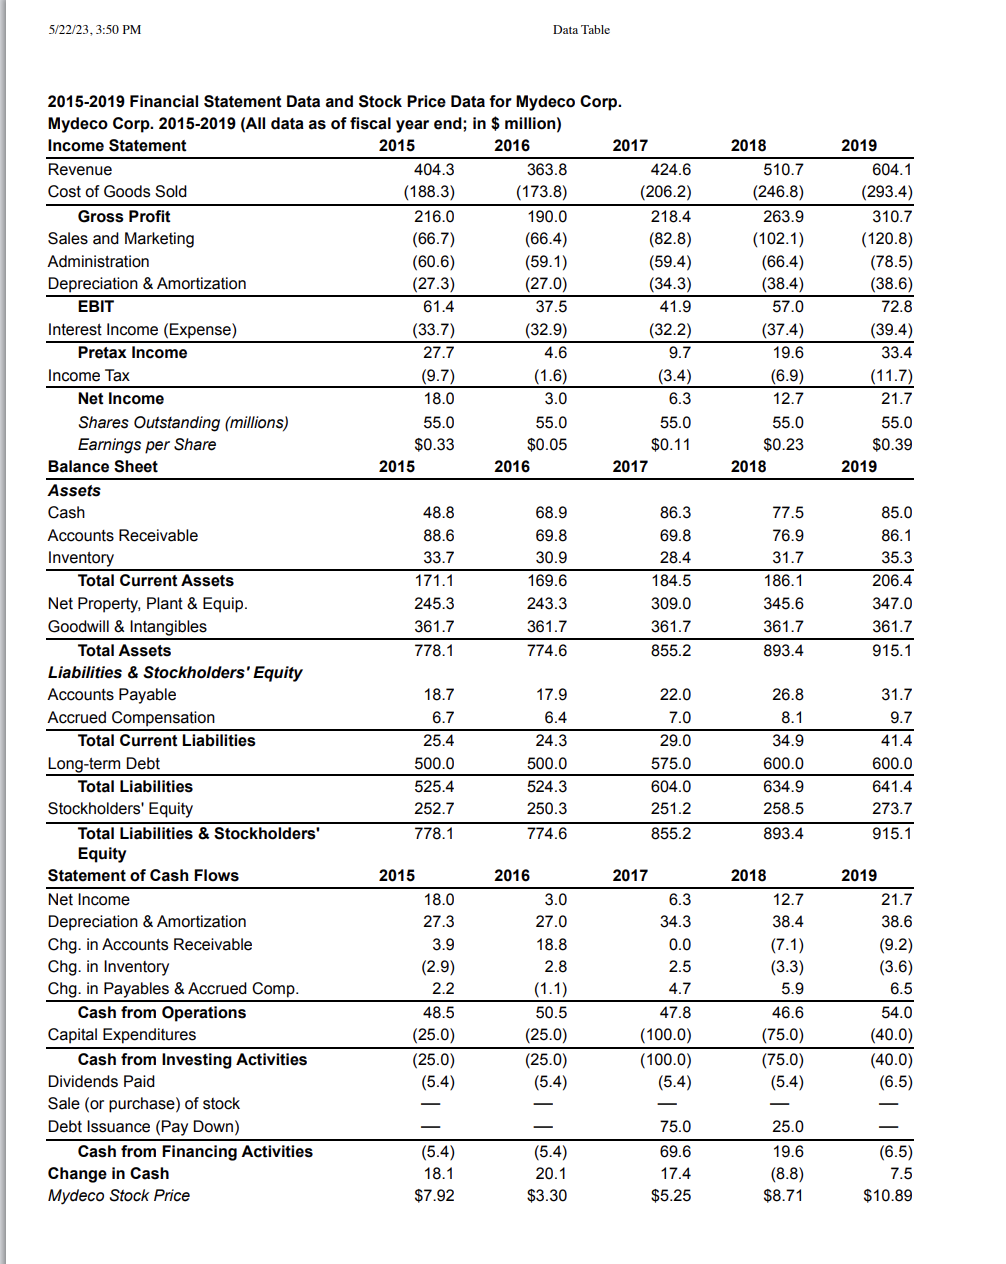
Question: See Table 2.5 a showing nancial statement data and stock price data for Mydeco Corp. Suppose Mydeco's costs and expenses had been the same fraction

See Table 2.5 a showing nancial statement dataSee Table 2.5 a showing nancial statement data
See Table 2.5 a showing nancial statement data and stock price data for Mydeco Corp. Suppose Mydeco's costs and expenses had been the same fraction of revenues in 20162019 as they were in 2015. What would Mvdeco's EPS have been each year in this case? Calculate the new EPS for 20162019 below: (Round dollar amounts and number of shares to one decimal place. Round percentage amount and the EPS to two decimal places.) Year 2016 Revenue (millions) $ 363.8 Net Prot Margin W % New Net Income (millions) $ 28.10 Shares Outstanding (millions) 53-6 New EPS $ 1.91 57'237'23. 3:50 PM Data Tablc 2015-2019 Financial Statement Data and Stock Price Data for Mydeco Corp. Mydeco Corp. 2015-2019 {All data as of fiscal year end; in $ million} Income Statement Revenue Cost of Goods Sold Gross Profit Sales and Marketing Administration Depreciation 8. Amortization EBIT Interest Income (Expense) Pretax Income Income Tax Net Income Shares Outstanding {miiir'ons} Earnings per Share Balance Sheet Assets Cash Accounts Receivable Inventory Total Current Assets Net Property. Plant & Equip. Goodwill 8. Intangibles Total Assets Liabiiities & Stockholders ' Equity Accounts Payable Accrued Compensation Total Current Liabilities Long-term Debt Total Liabilities Stockholders' Equity Total Liabilities 8. Stockholders' Equity Statement of Cash Flows Net Income Depreciation 8. Amortization Chg. in Accounts Receivable Chg. in Inventory Chg. in Payables &Accrued Comp. Cash from Operations Capital Expenditures Cash from Investing Activities Dividends Paid Sale (or purchase) of stock Debt Issuance (Pay Down) Cash from Financing Activities Change in Cash Mydeco Stock Price 2015 4043 (199.3) 2190 (95.7) (90.9) (27.3) 914 (33.7) 277 (9.7) 190 550 $0.33 2015 48.8 88.6 33.? 1?1 .1 245.3 361 .? ??8.1 1 8.? 6.? 25.4 500.0 525.4 252.? ??8.1 2015 190 273 39 (2.9) 22 495 (25.0) (25.0) (54) (5.4) 18.1 $?.92 2019 353.9 (1735) 190.0 (994) (597) (275) 375 (329) 45 0.9) 30 550 $0 .05 201 6 68.9 69.8 30.9 169.6 243.3 361.? ??4.6 1?.9 6.4 24.3 500.0 524.3 250.3 ??4.6 2019 30 27.0 19.9 25 (17) 50.5 (255) (255) (54) (5.4) 20.1 $3.30 2017 4245 (2092) 2194 (925) (594) (343) 419 (322) 97 (34) 93 590 $0.11 201? 86.3 69.8 28.4 184.5 309.0 361.? 855.2 22.0 ?.0 29.0 5?5.0 604.0 251.2 855.2 2017 93 343 00 25 47 479 0005) (1005) (54) ?5.0 69.6 1?.4 $5.25 2019 510.? (2499) 2939 (1024) (994) (394) 575 (324) 195 (99) 127 555 $0.23 2018 ??.5 ?6.9 31.? 186.1 345.6 361.? 893.4 26.8 8.1 34.9 600.0 634.9 258.5 893.4 2019 127 394 (73) (3.3) 55 465 (790) (790) (94) 255 195 (99) $971 2019 9041 @994) 3107 0209) (795) (399) 729 (394) 334 (117) 217 590 $0.39 2019 85.0 86.1 35.3 206.4 34?.0 361.? 915.1 31.? 9.? 41.4 600.0 641.4 2?3.? 915.1 2019 217 390 (92) (35) 95 540 500) (400) (55) (65) 75 91059

Step by Step Solution

There are 3 Steps involved in it

1 Expert Approved Answer
Step: 1 Unlock blur-text-image
Question Has Been Solved by an Expert!

Get step-by-step solutions from verified subject matter experts

Step: 2 Unlock
Step: 3 Unlock

Students Have Also Explored These Related Finance Questions!