

Question: 26. See Table 2.5 E showing financial statement data and stock price data for Mydeco Corp. a. By how much did Mydeco increase its debt
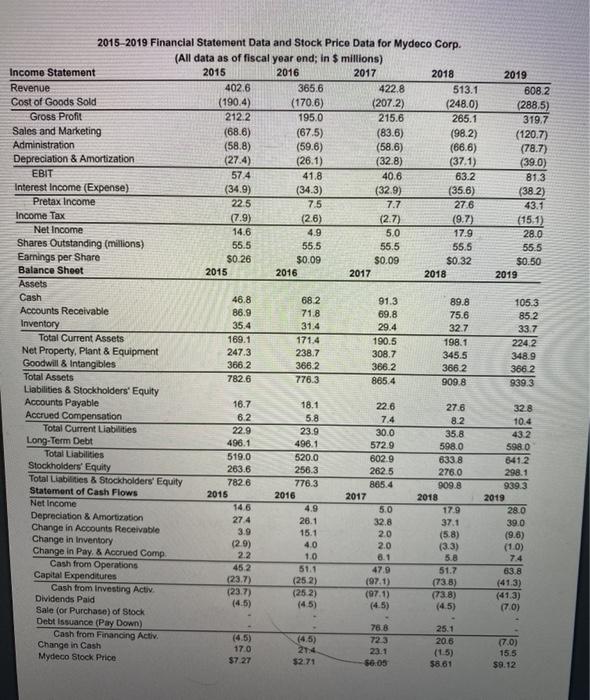
See Table 2.5 E showing financial statement data and stock price data for Mydeco Corp. a. By how much did Mydeco increase its debt from 2015 to 2019? b. What was Mydeco's EBITDA/Interest coverage ratio in 2015 and 2019? Did its coverage ratio ever fall below 2.00? c. Overall, did Mydeco's ability to meet its interest payments improve or decline over this period? a. By how much did Mydeco increase its debt from 2015 to 2019? (Select from the drop-down menu.) Mydeco increased its debt by million from 2015 to 2019. 2019 608.2 (288,5) 319.7 (120.7) (78.7) (39.0) 81.3 (38.2) 43.1 (15.1) 28.0 55.5 $0.50 2019 7.7 2015-2019 Financial Statement Data and Stock Prico Data for Mydeco Corp. (All data as of fiscal year end; in $ millions) Income Statement 2015 2016 2017 2018 Revenue 402.6 365.6 422.8 513.1 Cost of Goods Sold (1904) (170.6) (207.2) (248.0) Gross Profil 212.2 195.0 215.6 265.1 Sales and Marketing (68.6) (67.5) (83.6) (98.2) Administration (58.8) (59.6) (58.6) (666) Depreciation & Amortization (27.4) (26.1) (32.8) (371) EBIT 57.4 41.8 40.6 63.2 Interest Income (Expense) (34.9) (34.3) (32.9) (35.6) Pretax income 22.5 7.5 27.6 Income Tax (7.9) (2.6) (2.7) (9.7) Net Income 14.6 4.9 5.0 17.9 Shares Outstanding (millions) 55.5 55.5 55,5 55.5 Earnings per Share $0.26 $0.09 $0.09 $0.32 Balance Sheet 2015 2016 2017 2018 Assets Cash 46.8 682 91.3 89.8 Accounts Receivable 86.9 71.8 69.8 75.6 Inventory 35.4 31.4 29.4 32.7 Total Current Assets 169.1 1714 190.5 198.1 Net Property, Plant & Equipment 247.3 238.7 308.7 345.5 Goodwill & Intangibles 366.2 366.2 366.2 366.2 Total Assets 782.6 776.3 865.4 909.8 Liabilities & Stockholders' Equity Accounts Payable 16.7 18.1 22.6 27.6 Accrued Compensation 6.2 5.8 7.4 8.2 Total Current Liabilities 23.9 30.0 35.8 Long-Term Debt 496.1 496.1 572.9 598.0 Total Liabilities 519.0 520.0 602.9 6338 Stockholders' Equity 263.6 256.3 2625 276.0 Total Liabilities & Stockholders' Equity 7826 776.3 885.4 909.8 Statement of Cash Flows 2015 2016 2017 2018 Net Income 146 4.9 5.0 179 Depreciation & Amortization 274 26.1 32.8 37.1 Change in Accounts Receivable 3.9 15.1 20 (5.8) Change in Inventory (29) 40 2.0 (3.3) Change in Pay & Accrued Comp 22 1.0 5.8 Cash from Operations 452 51.1 47.9 51.7 Capital Expenditures (252) (1971) (738) Cash from Investing Activ (252) (971) (738) Dividends Paid (4.5) (4.5) (4.5) Sale (or Purchase) of Stock Debt issuance (Pay Down) 788 25.1 Cash from Financing Activ (4.5) 723 20.6 Change in Cash 17.0 214 23.1 (15) Mydeco Stock Price $7.27 $2.71 $6.05 $8.61 105.3 85.2 33.7 224,2 348.9 3662 939.3 22.9 328 10.4 43.2 5980 8412 298.1 939.3 2019 28.0 39.0 (9.6) (1.0) 7.4 63.8 (413) (413) (70) (237) (45) 7.0) 15.5 $9.12
Step by Step Solution
There are 3 Steps involved in it

Get step-by-step solutions from verified subject matter experts