

Question: See Table showing financial statement data and stock price data for Mydeco Corp a. How did Mydeco's accounts receivable days change over this period? The
See Table showing financial statement data and stock price data for Mydeco Corp
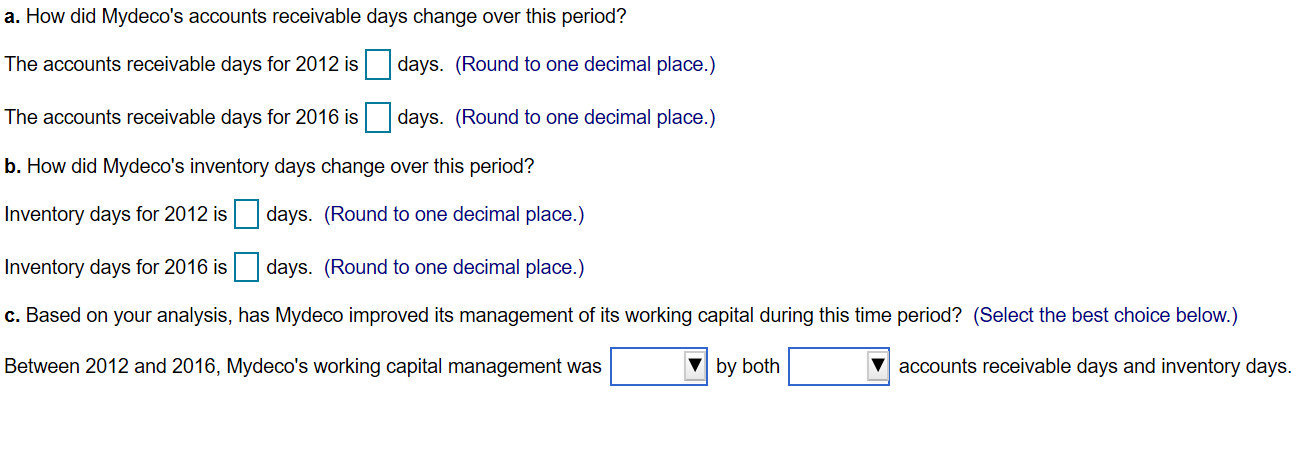
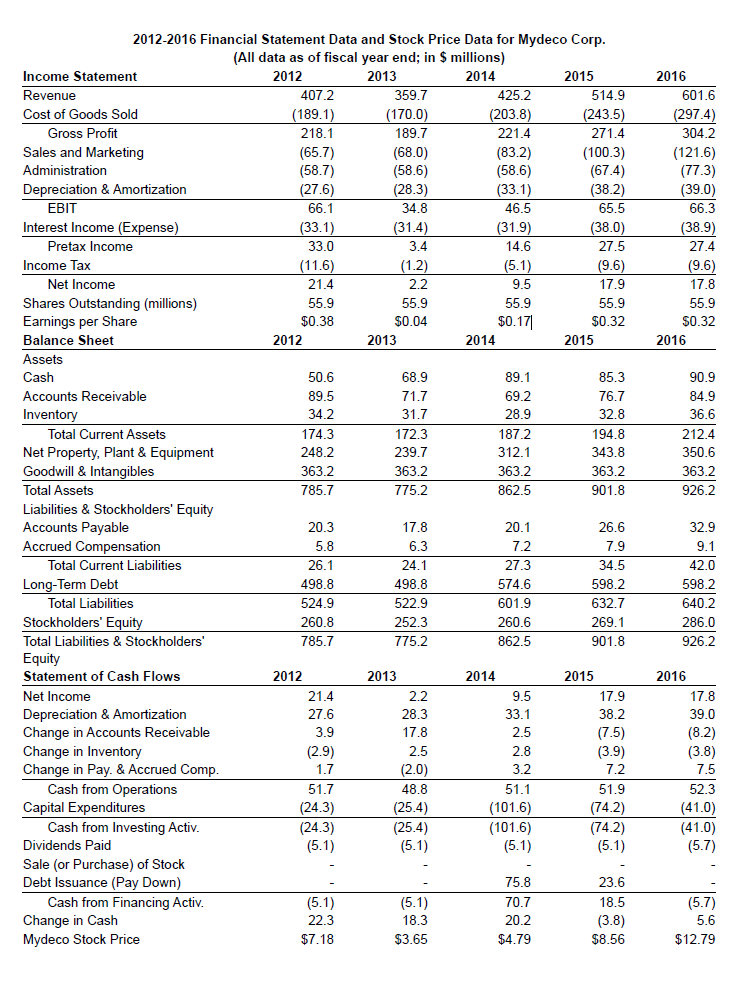
a. How did Mydeco's accounts receivable days change over this period? The accounts receivable days for 2012 is days. (Round to one decimal place.) The accounts receivable days for 2016 is ys. (Round to one decimal place.) b. How did Mydeco's inventory days change over this period? Inventory days for 2012 is days. (Round to one decimal place.) Inventory days for 2016 is days. (Round to one decimal place.) c. Based on your analysis, has Mydeco improved its management of its working capital during this time period? (Select the best choice below.) Between 2012 and 2016, Mydeco's working capital management was by both accounts receivable days and inventory days. 2015 2016 601.6 (297.4) 304.2 (65.7) (121.6) (77.3) (39.0) 66.3 (38.9) 27.4 (9.6) 17.8 55.9 $0.32 2016 2.2 $0.04 89.1 2012-2016 Financial Statement Data and Stock Price Data for Mydeco Corp. (All data as of fiscal year end; in $ millions) Income Statement 2012 2013 2014 Revenue 407.2 359.7 425.2 514.9 Cost of Goods Sold (189.1) (170.0) (203.8) (243.5) Gross Profit 218.1 189.7 221.4 271.4 Sales and Marketing (68.0) (83.2) (100.3) Administration (58.7) (58.6) (58.6) (67.4) Depreciation & Amortization (27.6) (28.3) (33.1) (38.2) EBIT 66.1 34.8 46.5 65.5 Interest Income (Expense) (33.1) (31.4) (31.9) (38.0) Pretax Income 33.0 3.4 14.6 27.5 Income Tax (11.6) (1.2) (5.1) (9.6) Net Income 21.4 9.5 17.9 Shares Outstanding (millions) 55.9 55.9 55.9 55.9 Earnings per Share $0.38 $0.17 $0.32 Balance Sheet 2012 2013 2014 2015 Assets Cash 50.6 68.9 85.3 Accounts Receivable 89.5 71.7 69.2 76.7 Inventory 34.2 31.7 28.9 32.8 Total Current Assets 174.3 172.3 187.2 194.8 Net Property, Plant & Equipment 248.2 239.7 312.1 343.8 Goodwill & Intangibles 363.2 363.2 363.2 363.2 Total Assets 785.7 775.2 862.5 Liabilities & Stockholders' Equity Accounts Payable 20.3 17.8 20.1 26.6 Accrued Compensation 5.8 6.3 7.2 7.9 Total Current Liabilities 26.1 24.1 27.3 34.5 Long-Term Debt 498.8 498.8 574.6 598.2 Total Liabilities 524.9 522.9 601.9 632.7 Stockholders' Equity 260.8 252.3 260.6 269.1 Total Liabilities & Stockholders' 785.7 775.2 862.5 901.8 Equity Statement of Cash Flows 2012 2013 2014 2014 2015 Net Income 2.2 9.5 17.9 Depreciation & Amortization 27.6 28.3 33.1 38.2 Change in Accounts Receivable 3.9 17.8 2.5 (7.5) Change in Inventory (2.9) 2.5 2.8 (3.9) Change in Pay. & Accrued Comp. 1.7 3.2 7.2 Cash from Operations 51.7 48.8 51.1 51.9 Capital Expenditures (24.3) (25.4) (101.6) (742) Cash from Investing Activ. (24.3) (25.4) (101.6) (74.2) Dividends Paid (5.1) Sale (or Purchase) of Stock Debt Issuance (Pay Down) 75.8 23.6 Cash from Financing Activ. (5.1) (5.1) 70.7 18.5 Change in Cash 22.3 18.3 20.2 (3.8) Mydeco Stock Price $7.18 $3.65 $4.79 $8.56 90.9 84.9 36.6 212.4 350.6 363.2 926.2 901.8 32.9 9.1 42.0 598.2 640.2 286.0 926.2 21.4 (2.0) 2016 17.8 39.0 (8.2) (3.8) 7.5 52.3 (41.0) (41.0) (5.7) (5.1) (5.1) (5.1) (5.7) 5.6 $12.79
Step by Step Solution
There are 3 Steps involved in it

Get step-by-step solutions from verified subject matter experts