

Question: See Table showing financial statement data and stock price data for Mydeco Corp. a. What is Mydeco's market capitalization at the end of each year?
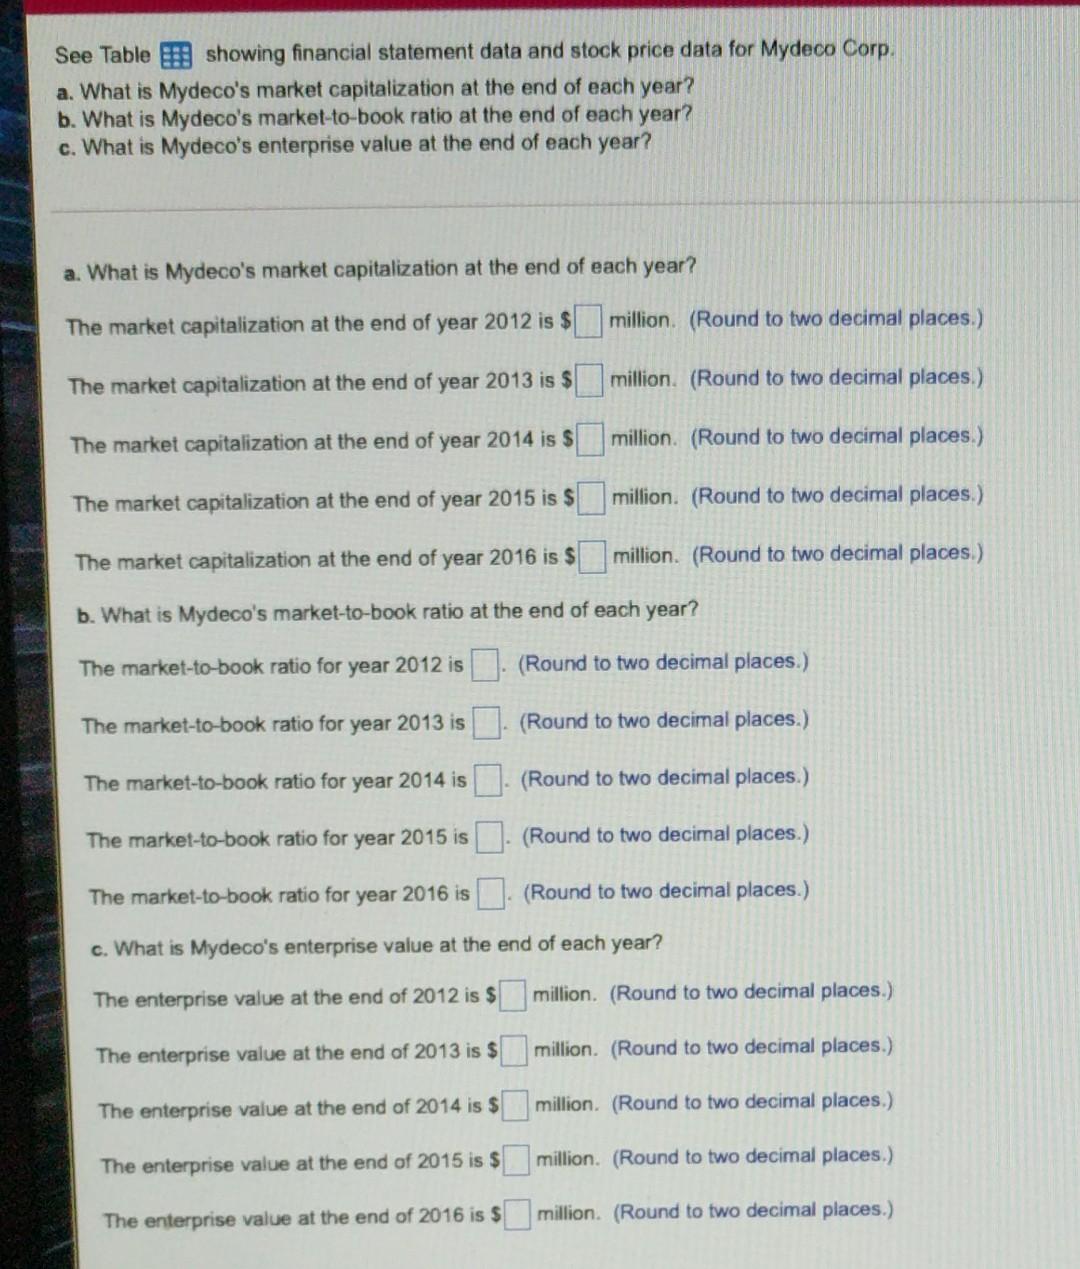
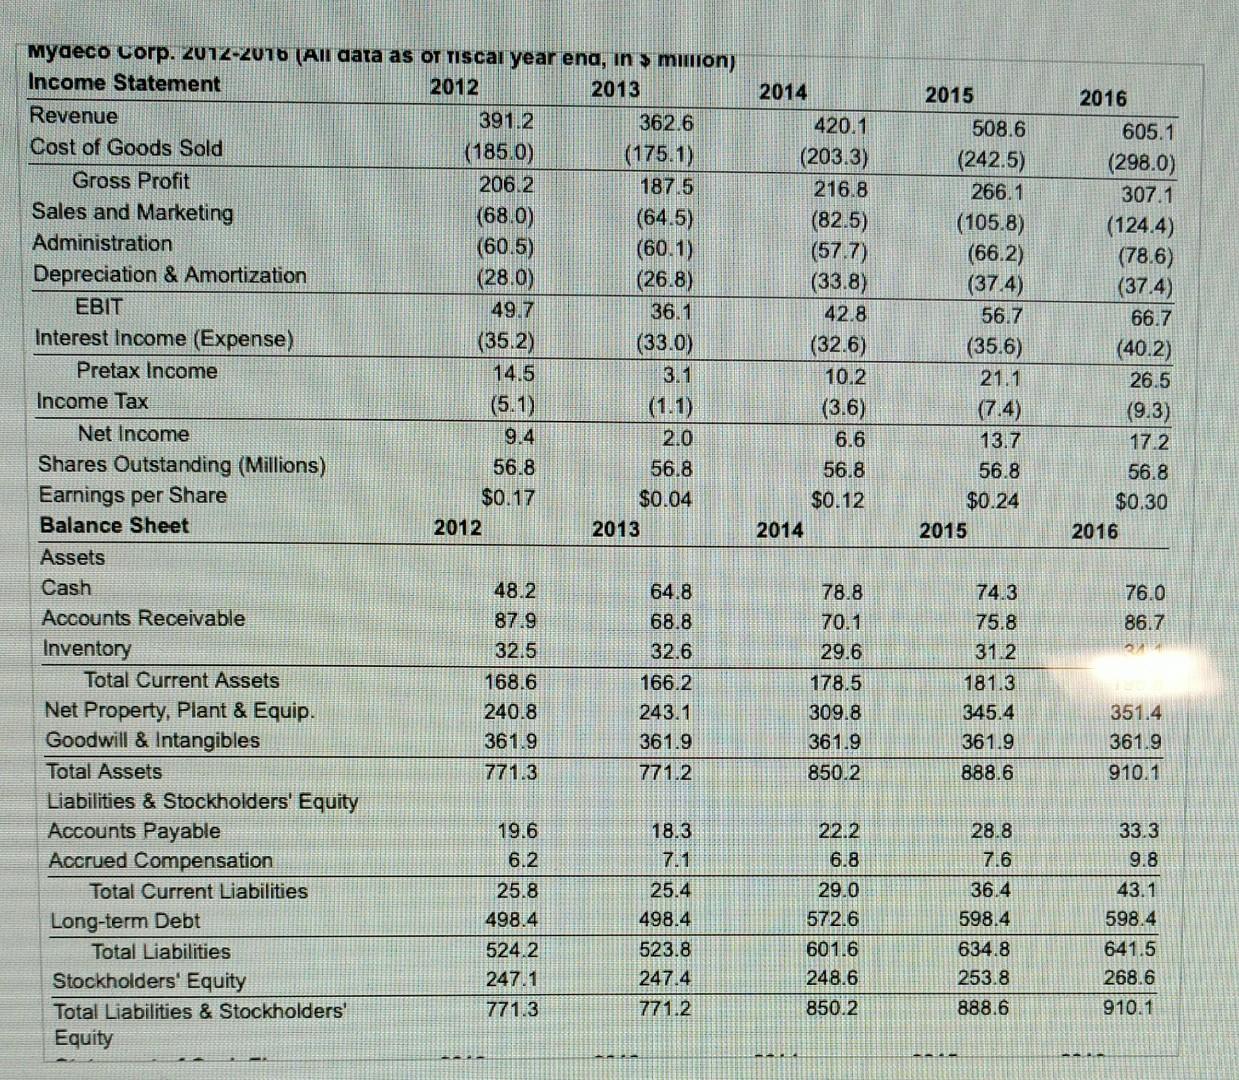
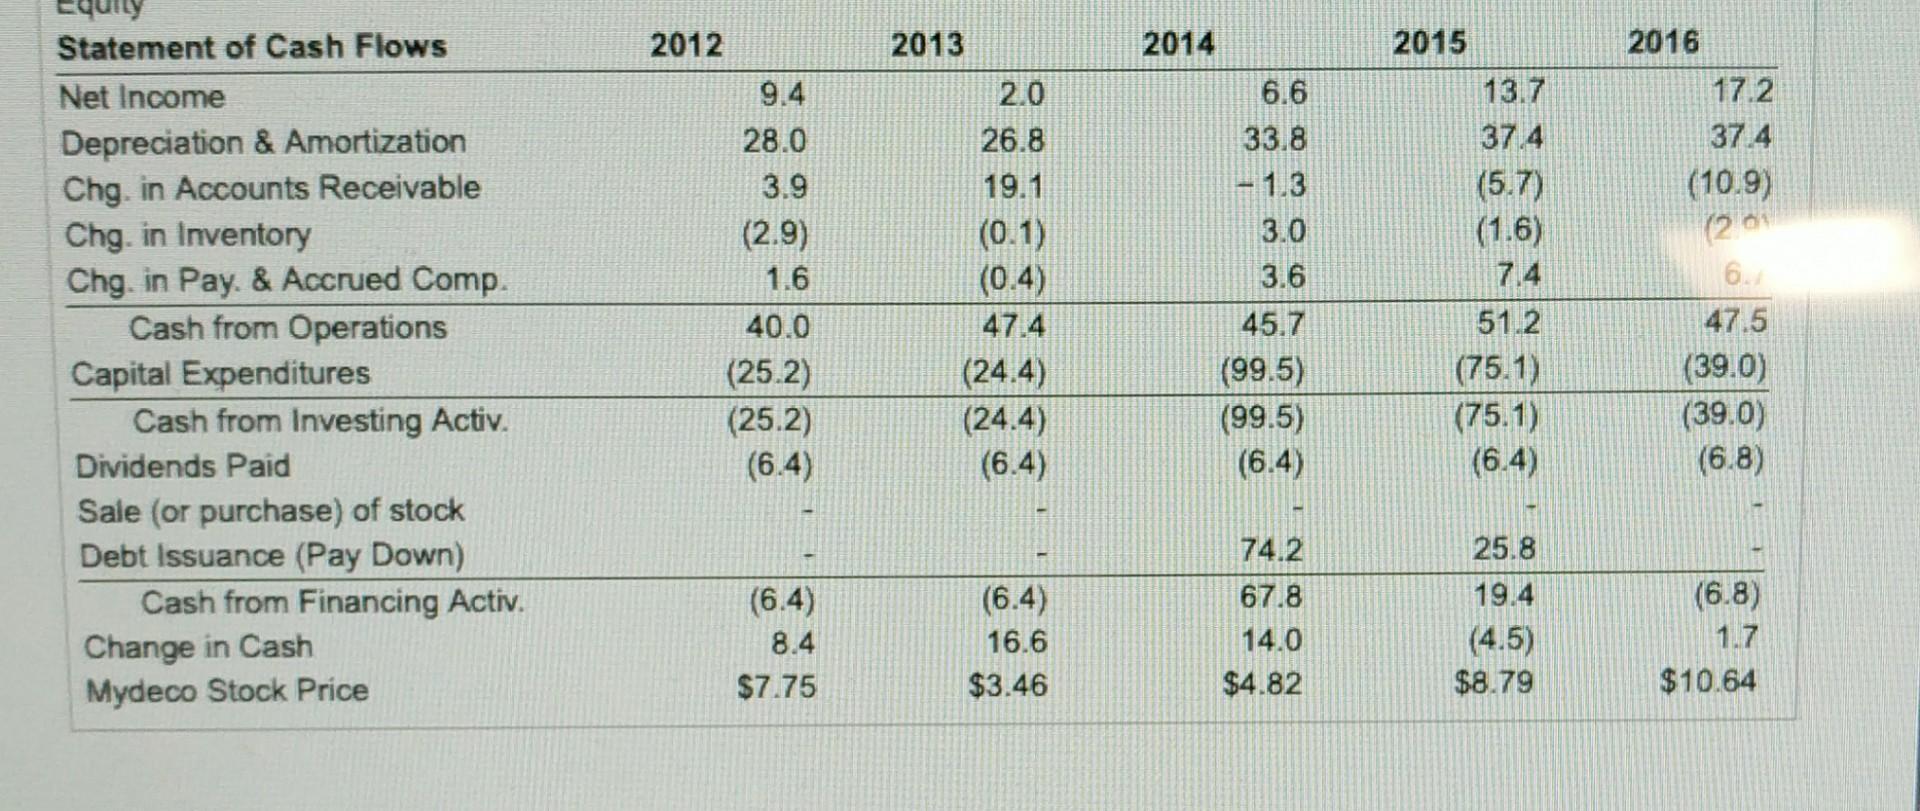
See Table showing financial statement data and stock price data for Mydeco Corp. a. What is Mydeco's market capitalization at the end of each year? b. What is Mydeco's market-to-book ratio at the end of each year? c. What is Mydeco's enterprise value at the end of each year? a. What is Mydeco's market capitalization at the end of each year? The market capitalization at the end of year 2012 is $ million (Round to two decimal places.) The market capitalization at the end of year 2013 is $ million (Round to two decimal places.) The market capitalization at the end of year 2014 is $ million. (Round to two decimal places.) The market capitalization at the end of year 2015 is $ million. (Round to two decimal places.) The market capitalization at the end of year 2016 is $ million. (Round to two decimal places.) b. What is Mydeco's market-to-book ratio at the end of each year? The market-to-book ratio for year 2012 is . (Round to two decimal places.) The market-to-book ratio for year 2013 is. (Round to two decimal places.) The market-to-book ratio for year 2014 is (Round to two decimal places.) The market-to-book ratio for year 2015 is (Round to two decimal places.) The market-to-book ratio for year 2016 is (Round to two decimal places.) c. What is Mydeco's enterprise value at the end of each year? The enterprise value at the end of 2012 is $ million. (Round to two decimal places.) The enterprise value at the end of 2013 is $ million. (Round to two decimal places.) The enterprise value at the end of 2014 is $ million. (Round to two decimal places.) The enterprise value at the end of 2015 is $ million. (Round to two decimal places.) The enterprise value at the end of 2016 is $ million. (Round to two decimal places.) 2014 420.1 (203.3) 216.8 (82.5) (57.7) (33.8) 42.8 (32.6) 10.2 (3.6) 6.6 56.8 $0.12 2014 2015 508.6 (242.5) 266.1 (105.8) (66.2) (374) 56.7 (35.6) 21.1 (7.4) 13.7 56.8 $0.24 2015 2016 605.1 (298.0) 307.1 (124.4) (78.6) (37.4) 66.7 (40.2) 26.5 (9.3) 17.2 56.8 $0.30 2016 Myaeco Corp. 2012-2016 (All data as OT TISCal year end, in $ million) Income Statement 2012 2013 Revenue 391.2 362.6 Cost of Goods Sold (185.0) (175.1) Gross Profit 206.2 187.5 Sales and Marketing (68.0) (64.5) Administration (60.5) (60.1) Depreciation & Amortization (28.0) (26.8) EBIT 49.7 36.1 Interest Income (Expense) (35.2) (33.0) Pretax Income 14.5 3.1 Income Tax (5.1) (1.1) Net Income 9.4 2.0 Shares Outstanding (Millions) 56.8 56.8 Earnings per Share $0.17 $0.04 Balance Sheet 2012 2013 Assets Cash 48.2 64.8 Accounts Receivable 87.9 68.8 Inventory 32.5 32.6 Total Current Assets 168.6 166.2 Net Property, Plant & Equip. 240.8 243.1 Goodwill & Intangibles 361.9 361.9 Total Assets 771.3 771.2 Liabilities & Stockholders' Equity Accounts Payable 19.6 18.3 Accrued Compensation 6.2 7.1 Total Current Liabilities 25.8 25.4 Long-term Debt 498.4 498.4 Total Liabilities 524.2 523.8 Stockholders' Equity 2471 247.4 Total Liabilities & Stockholders' 771.3 771.2 Equity 78.8 70.1 76.0 86.7 29.6 178.5 309.8 361.9 850.2 74.3 75.8 31.2 181.3 345.4 361.9 888.6 351.4 361.9 910.1 @ N 22.2 6.8 29.0 572.6 601.6 248.6 850.2 28.8 7.6 36.4 598.4 634.8 253.8 888.6 33.3 9.8 43.1 598.4 641.5 268.6 910.1 2015 13.7 37.4 (5.7) (1.6) Statement of Cash Flows Net Income Depreciation & Amortization Chg. in Accounts Receivable Chg. in Inventory Chg. in Pay. & Accrued Comp. Cash from Operations Capital Expenditures Cash from Investing Activ. Dividends Paid Sale (or purchase) of stock Debt Issuance (Pay Down) Cash from Financing Activ. Change in Cash Mydeco Stock Price 2012 9.4 28.0 3.9 (2.9) 1.6 40.0 (25.2) (25.2) (6.4) 2013 2.0 26.8 19.1 (0.1) (0.4) 47.4 (24.4) (24.4) (6.4) 2014 6.6 33.8 - 1.3 3.0 3.6 45.7 (99.5) (99.5) (6.4) 2016 17.2 37.4 (10.9) (20 6. 47.5 (39.0) (39.0) (6.8) 7.4 51.2 (75.1) (75.1) (6.4) (6.4) 8.4 $7.75 (6.4) 16.6 $3.46 74.2 67.8 14.0 $4.82 25.8 19.4 (4.5) $8.79 (6.8) 1.7 $10.64
Step by Step Solution
There are 3 Steps involved in it

Get step-by-step solutions from verified subject matter experts