

Question: See the examples in the lecture from the professor. The graph below represents an equation of the form trigi(z )trig2(2) - 1.75trigs(z) - 1.75 where
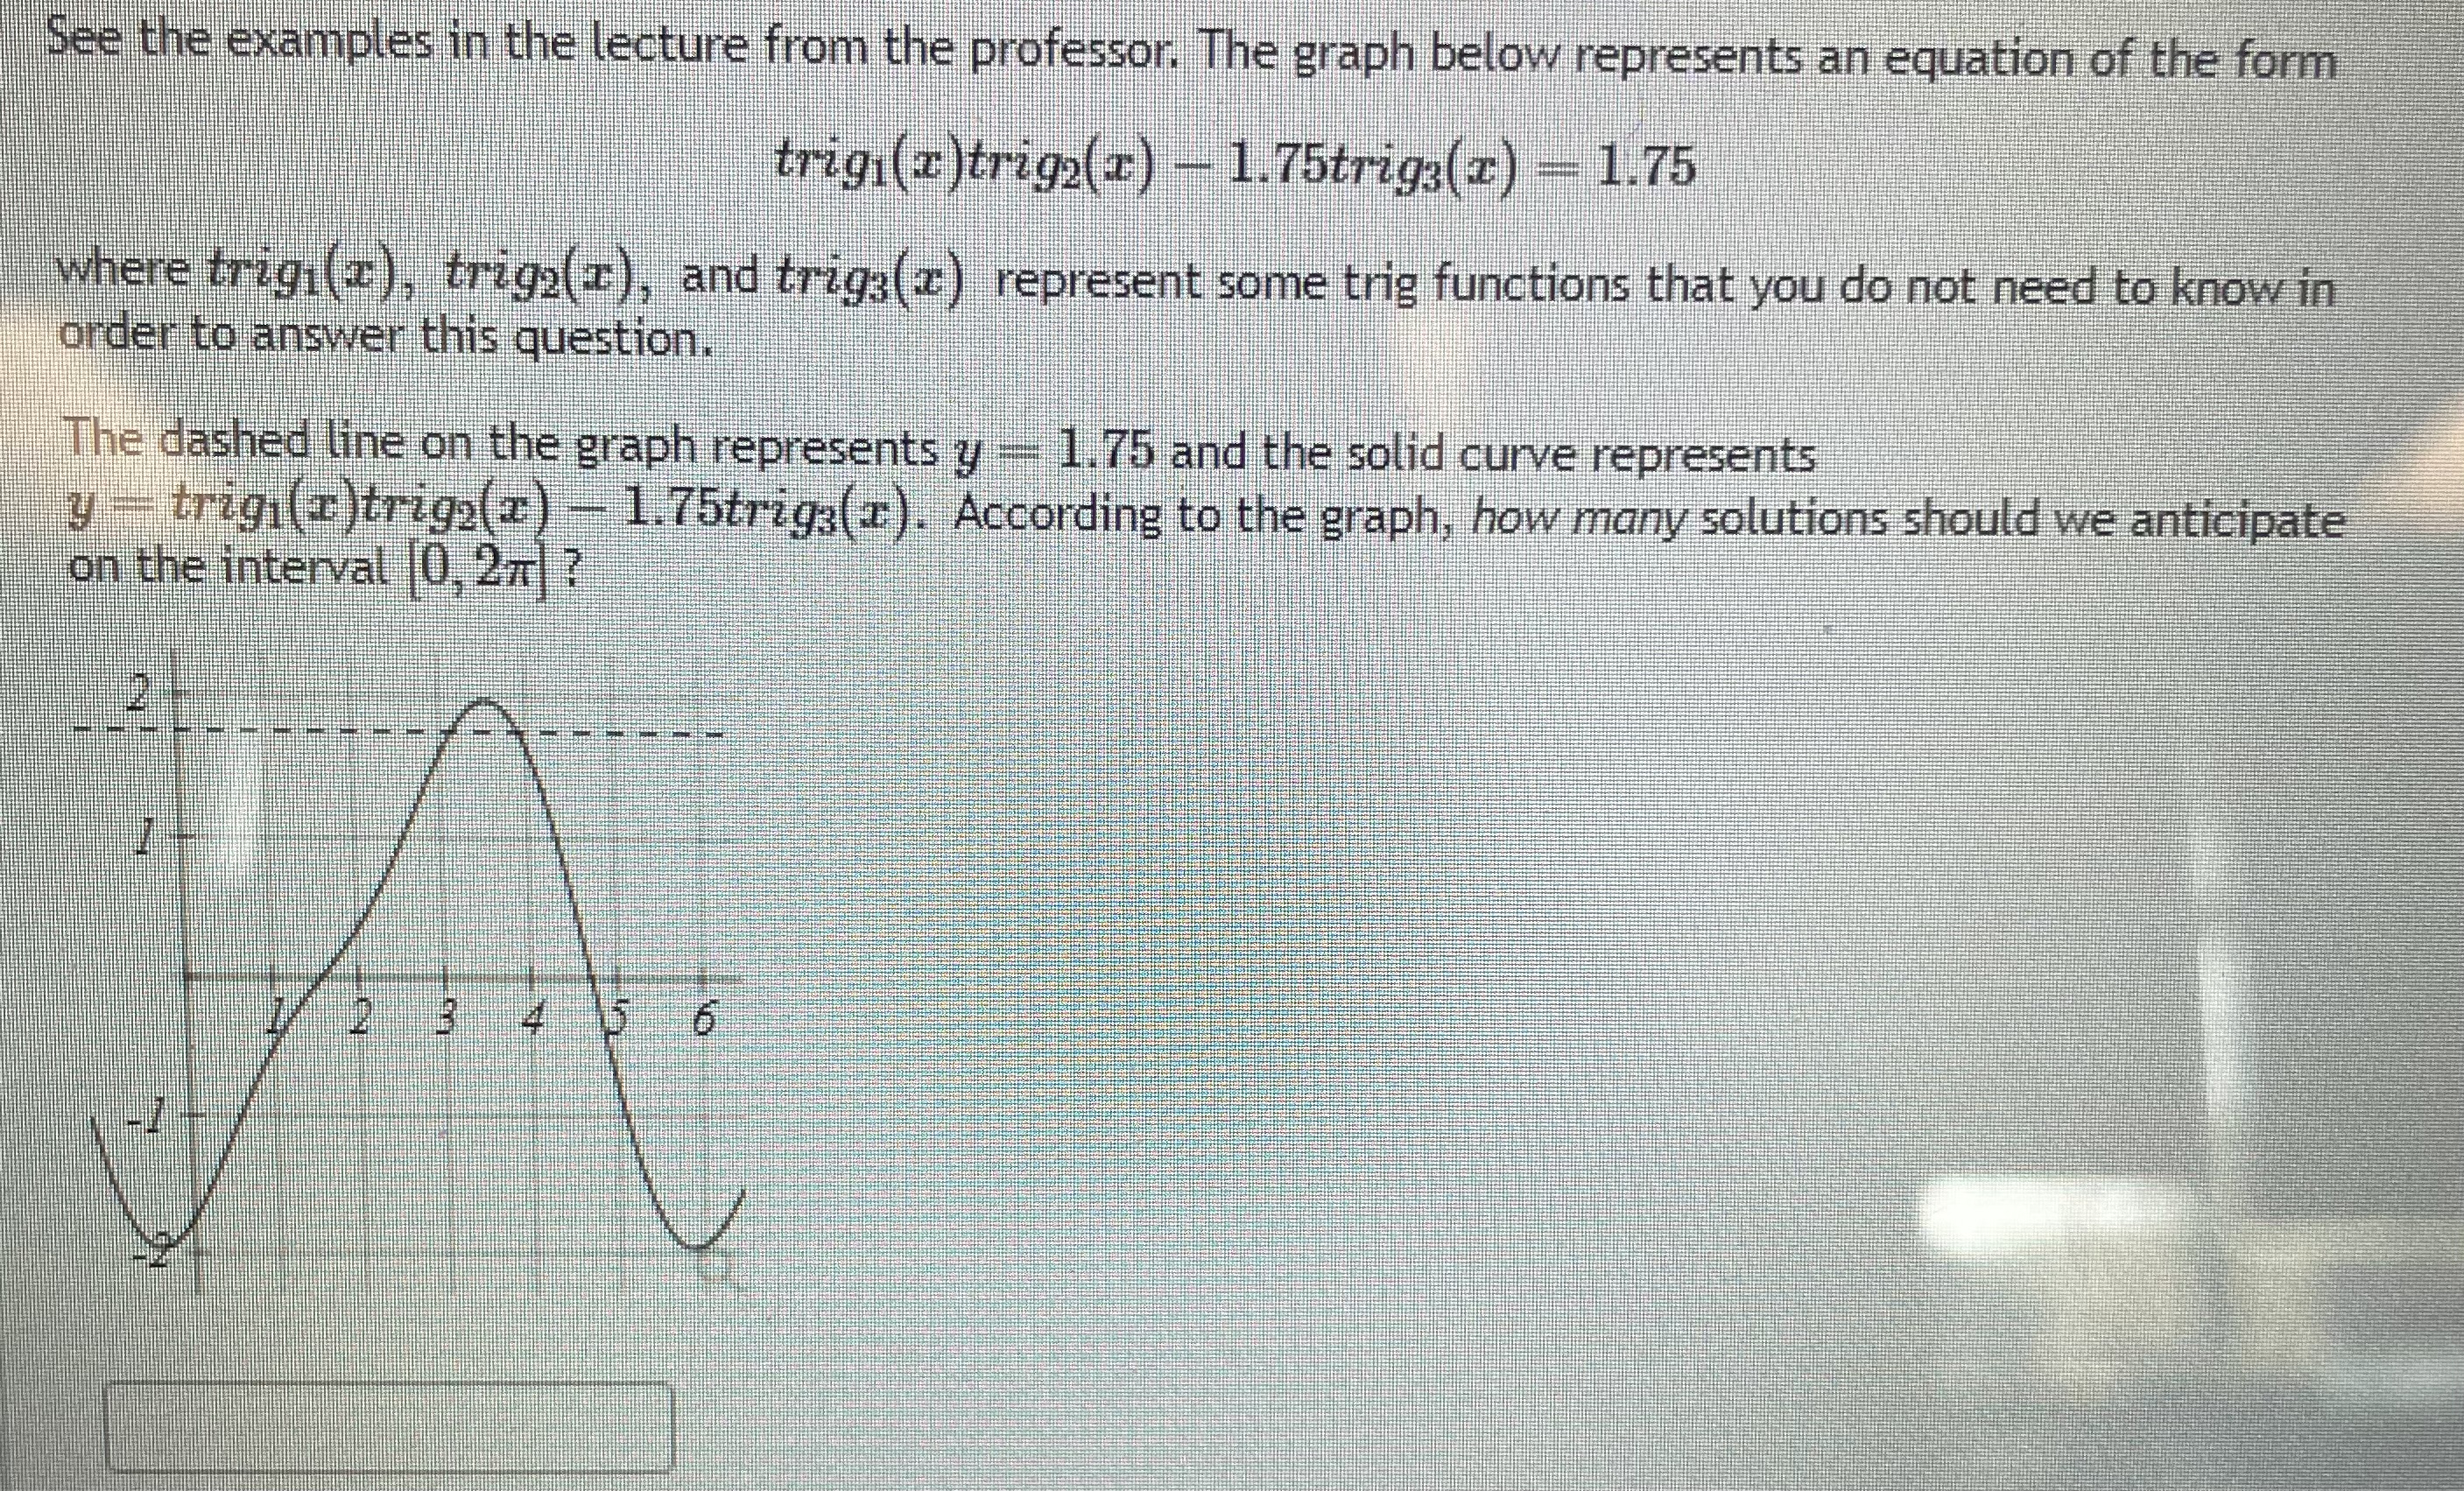
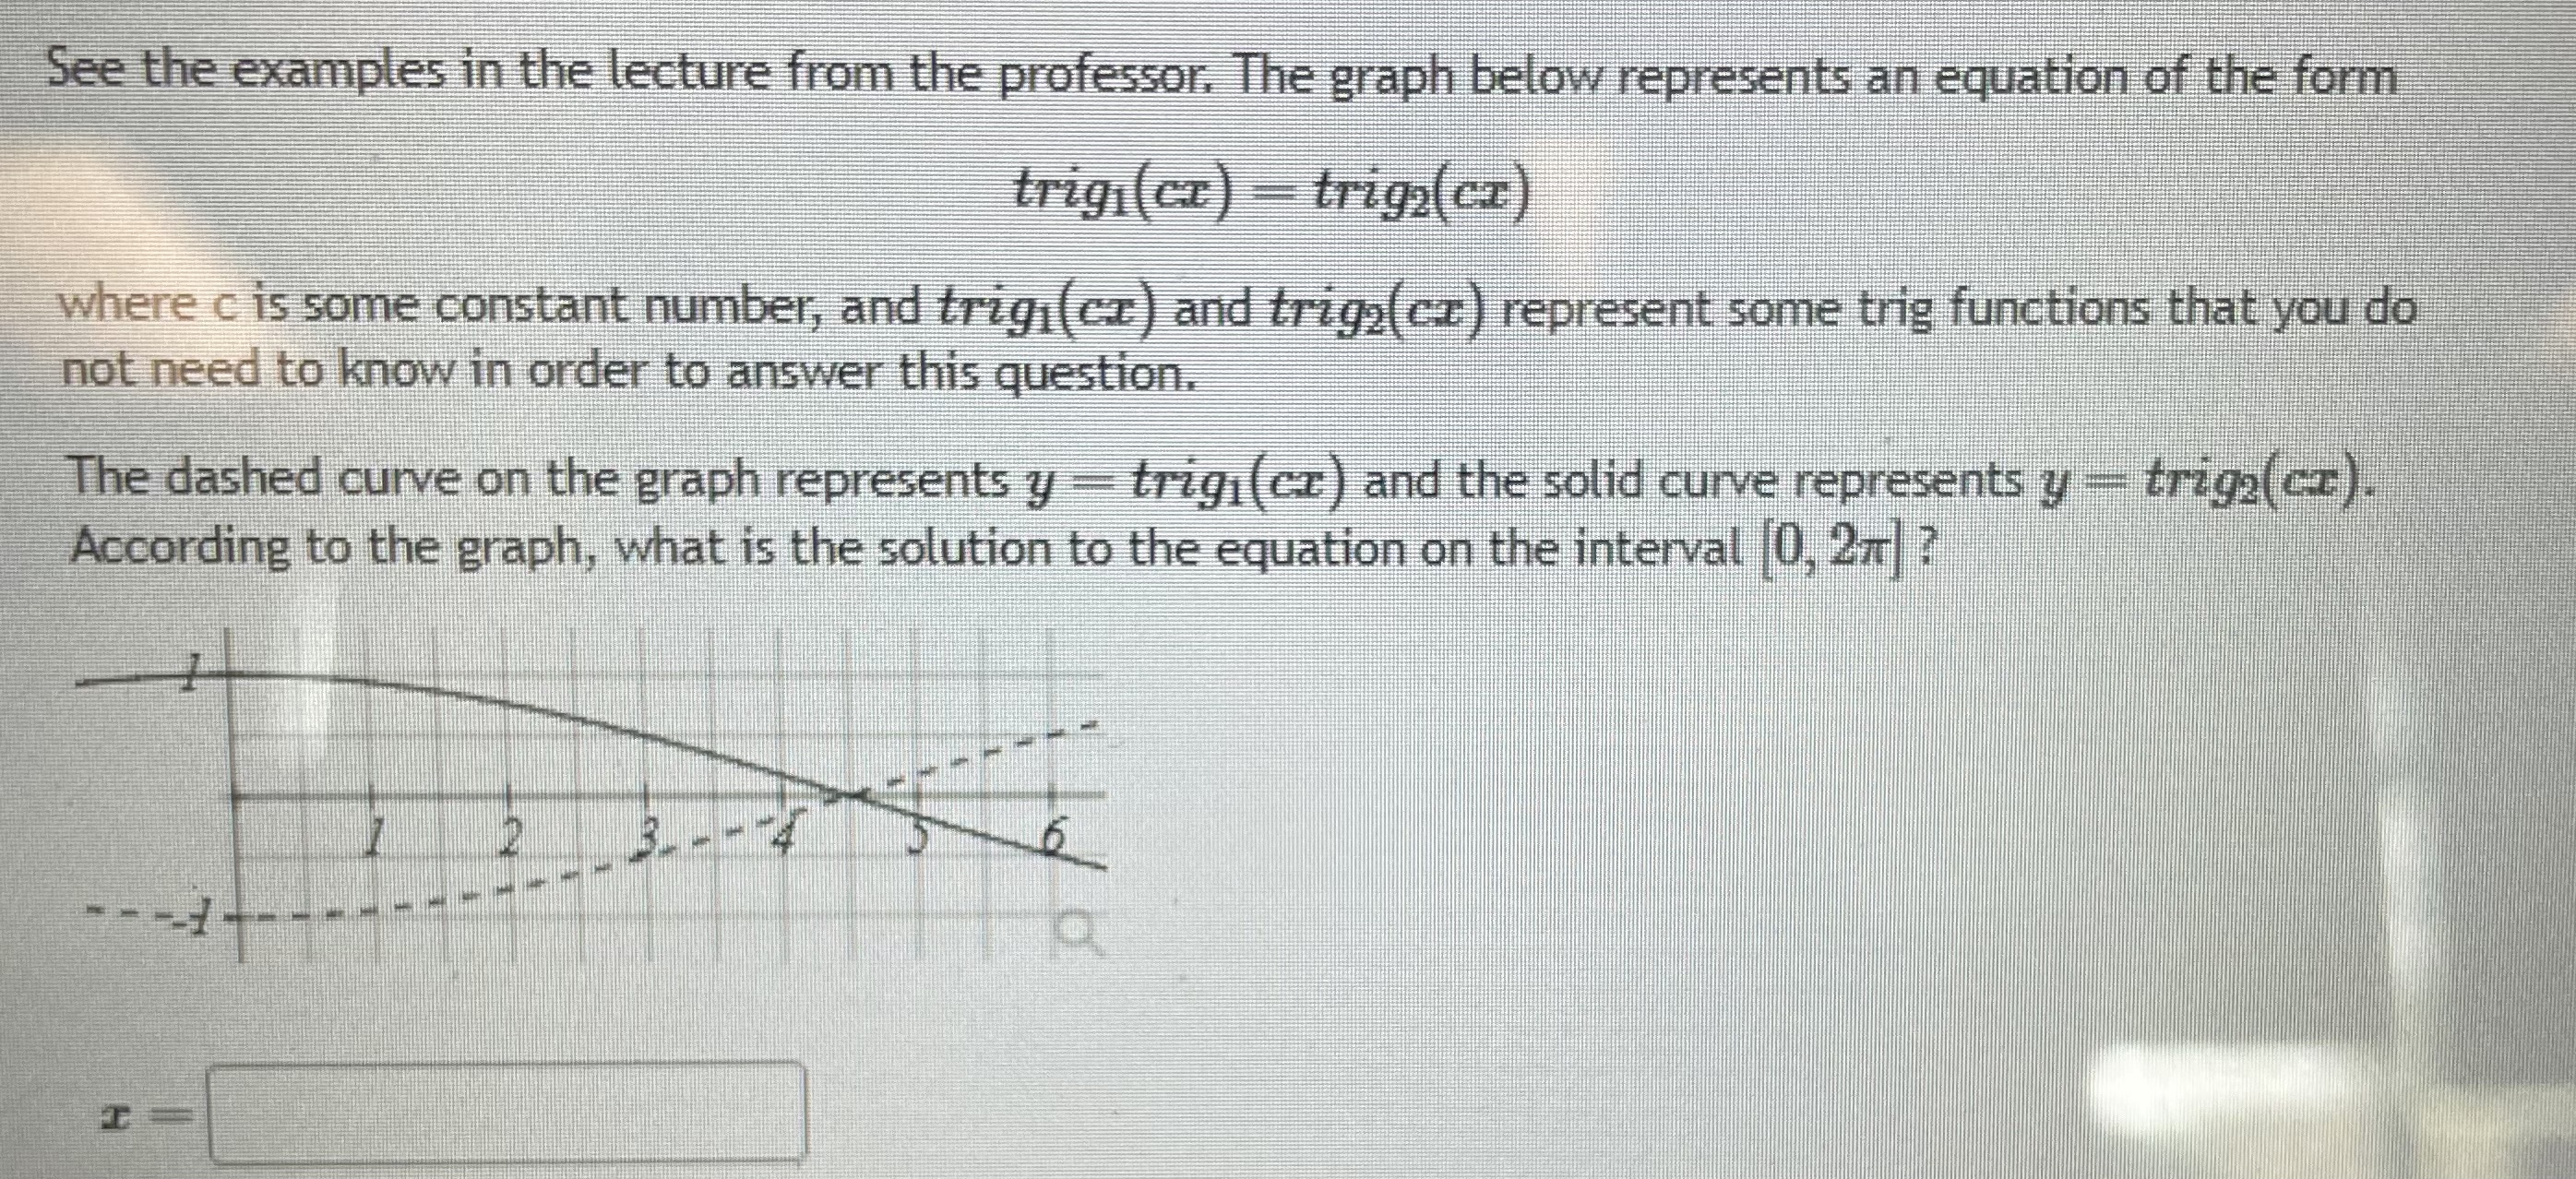
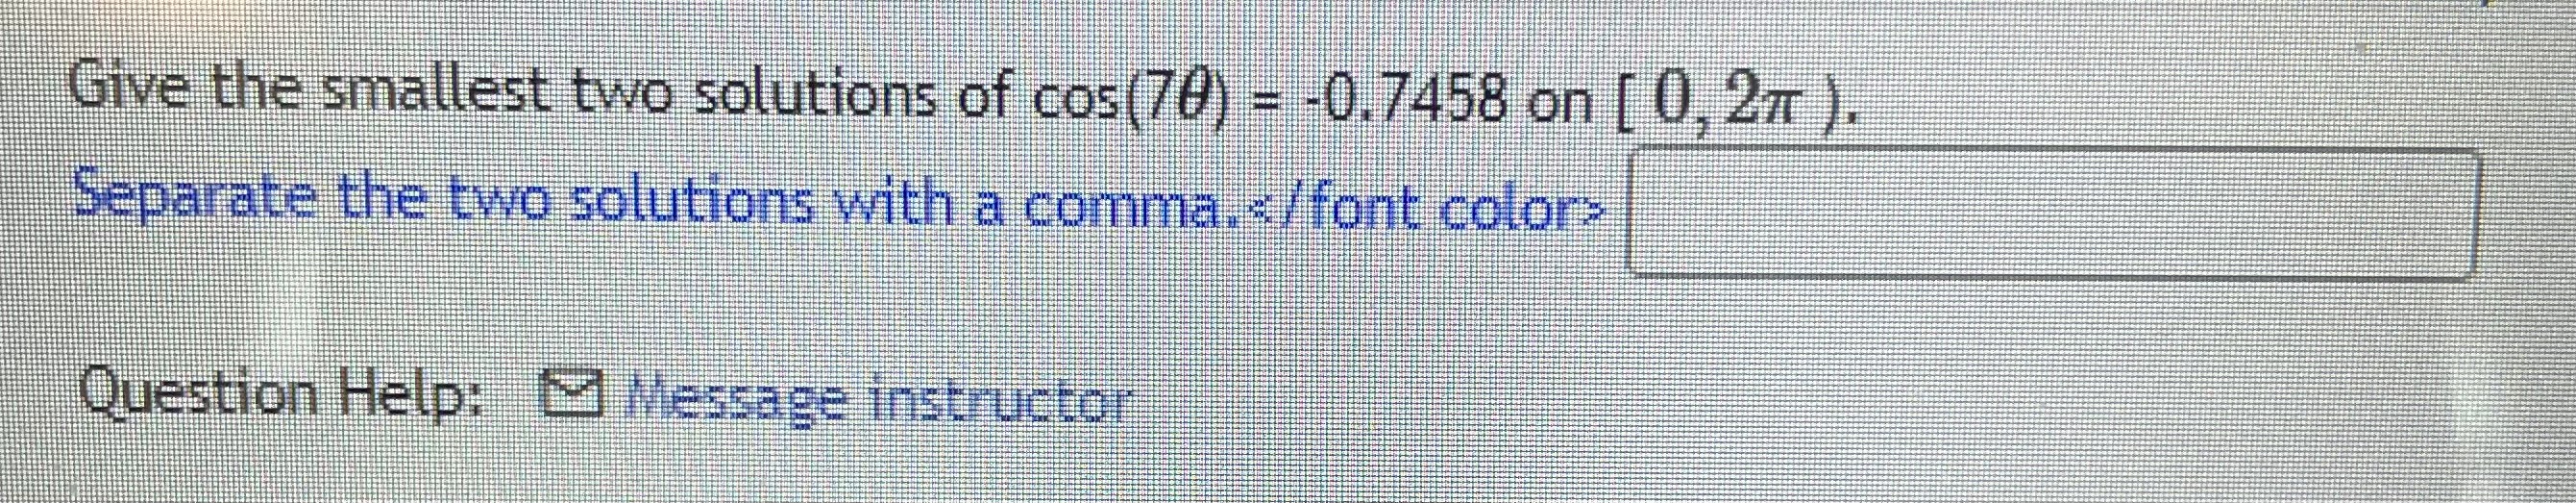
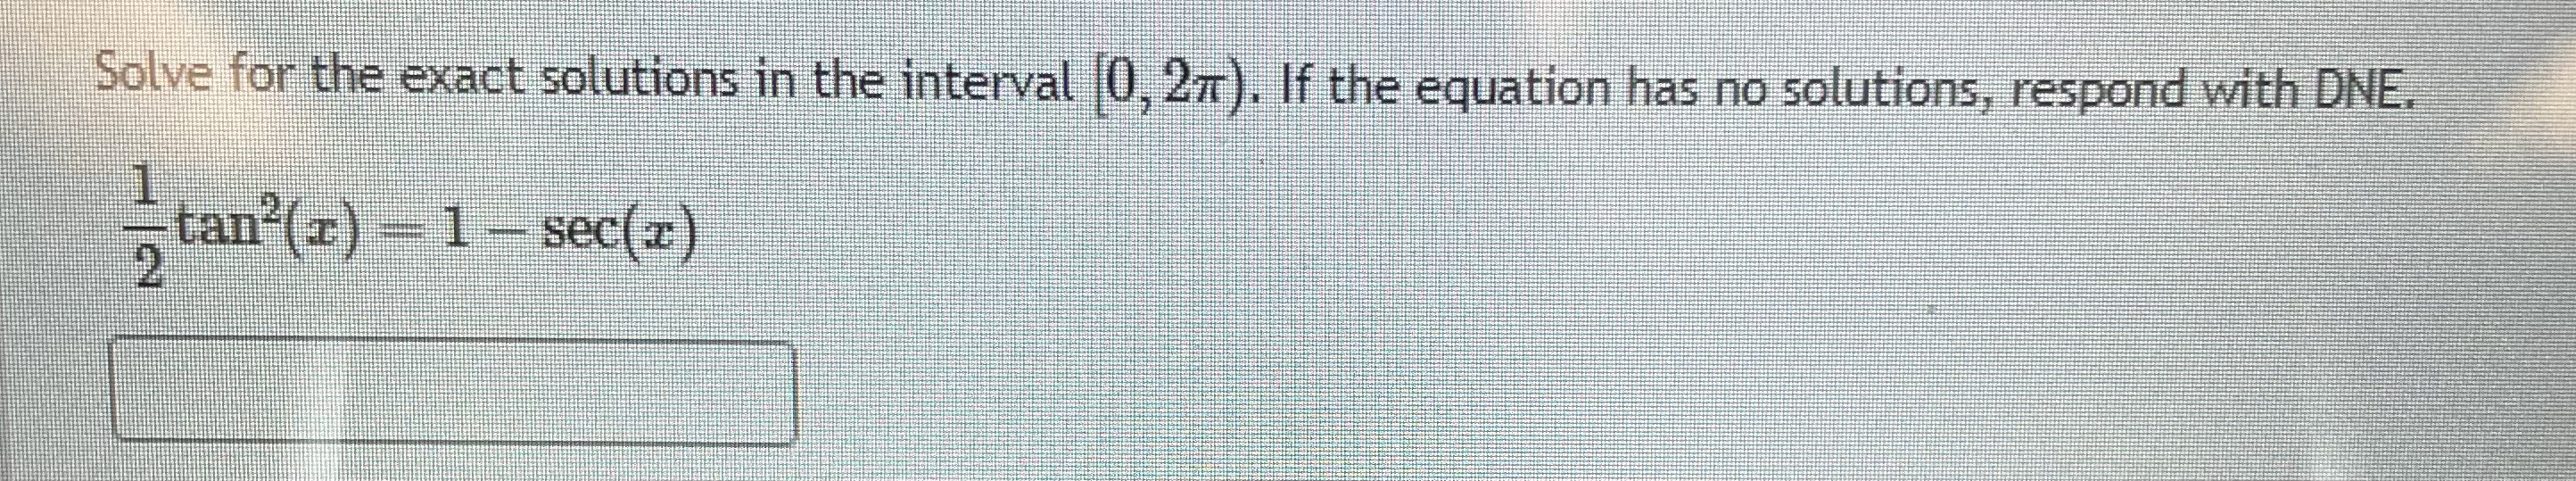

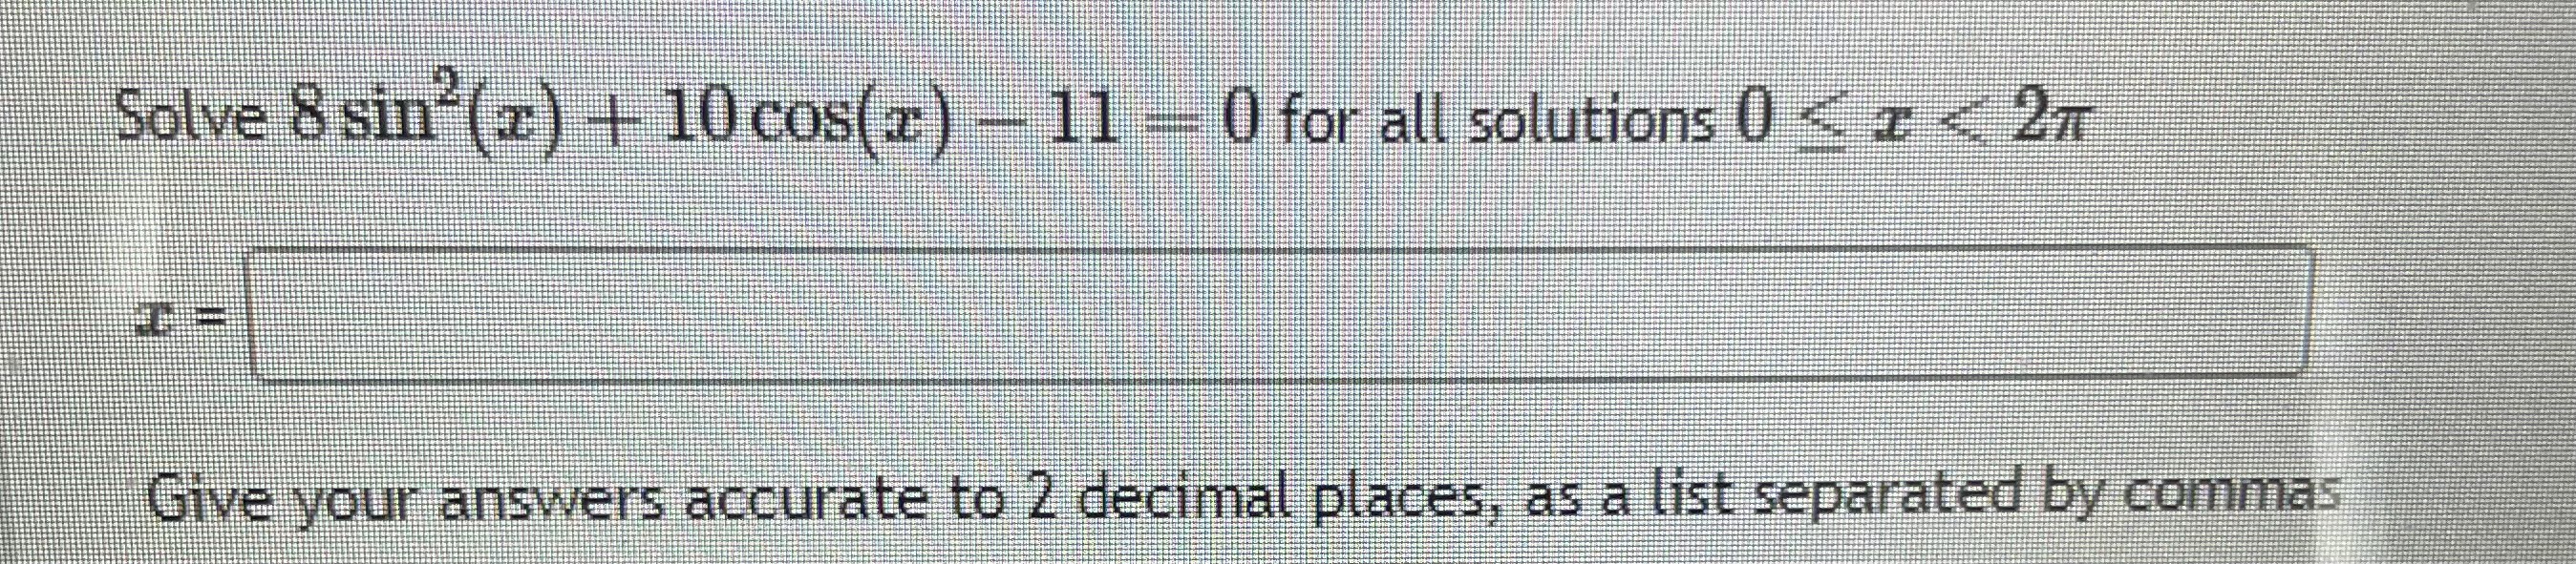
See the examples in the lecture from the professor. The graph below represents an equation of the form trigi(z )trig2(2) - 1.75trigs(z) - 1.75 where trig(z), trigg(I), and trigg(I) represent some trig functions that you do not need to know in order to answer this question. The dashed line on the graph represents y - 1.75 and the solid curve represents y - trigi(z)trigs(2) - 1.75trigs(). According to the graph, how many solutions should we anticipate on the interval |0, 27) ? 2 3 4 15 6See the examples in the lecture from the professor. The graph below represents an equation of the form trigi(er) = trigz( er) where c is some constant number, and trig(ex) and trigg( cz ) represent some trig functions that you do not need to know in order to answer this question. The dashed curve on the graph represents y = trig (cz ) and the solid curve represents y - trig2( cz). According to the graph, what is the solution to the equation on the interval 0, 2x] ? 6Give the smallest two solutions of cos (70) = -0.7458 on [ 0, 27 ). Separate the two solutions with a comma. color> Question Help: () Message instructorSolve for the exact solutions in the interval 0, 27). If the equation has no solutions, respond with DNE. tan-(x) - 1 - sec()Solve 4 cos(4x) - 3 for the smallest positive solution. Give your answer accurate to at least two decimal places.Solve 8 sin (z) + 10 cos(z) - 11 - 0 for all solutions 0
Step by Step Solution
There are 3 Steps involved in it

Get step-by-step solutions from verified subject matter experts