

Question: See the following graphs. The blue curve expresses the function y = f(x), while the red one represents y = g(x). Evaluate the following composite


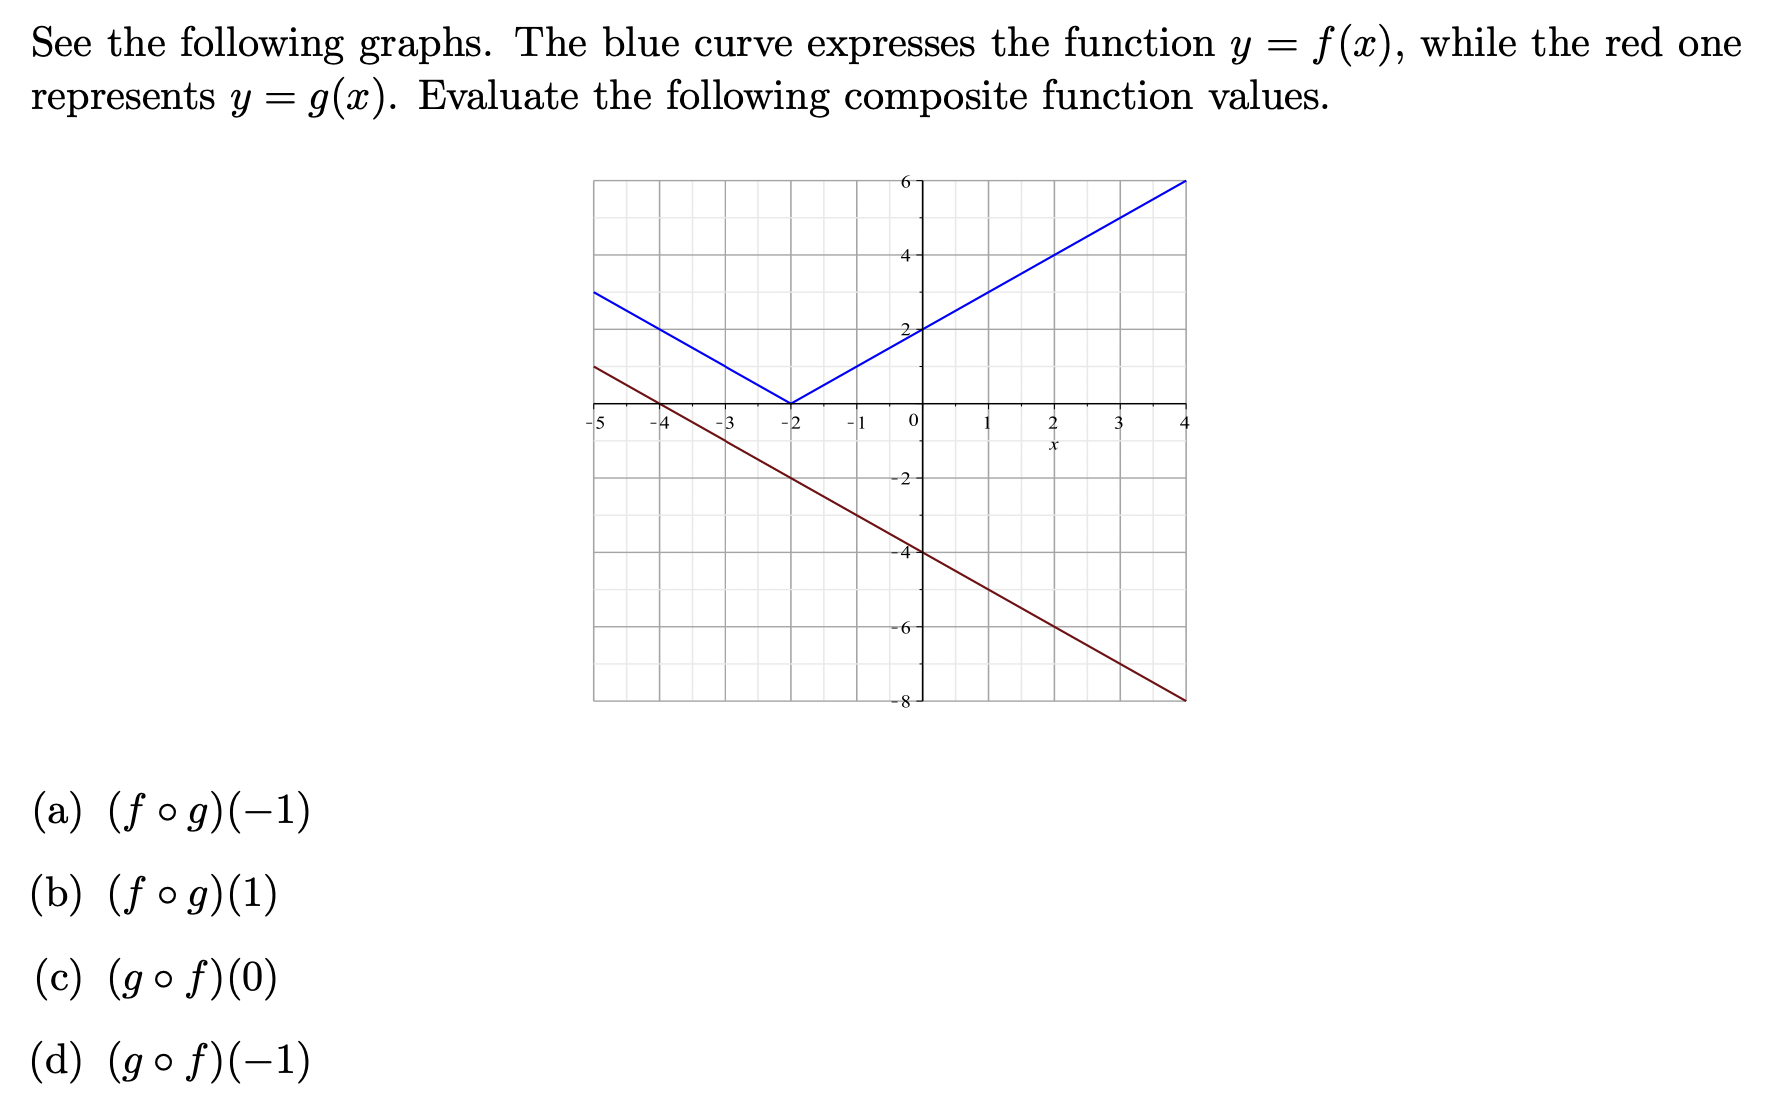
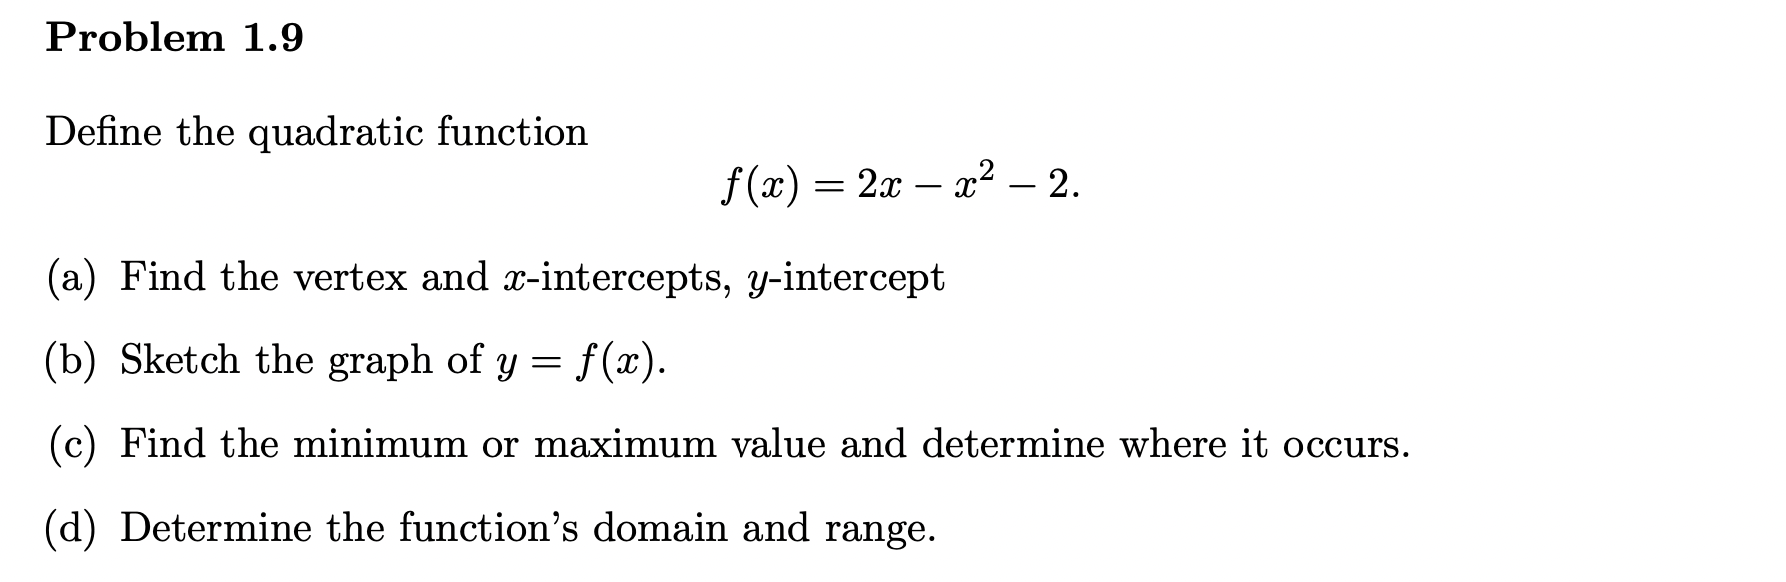
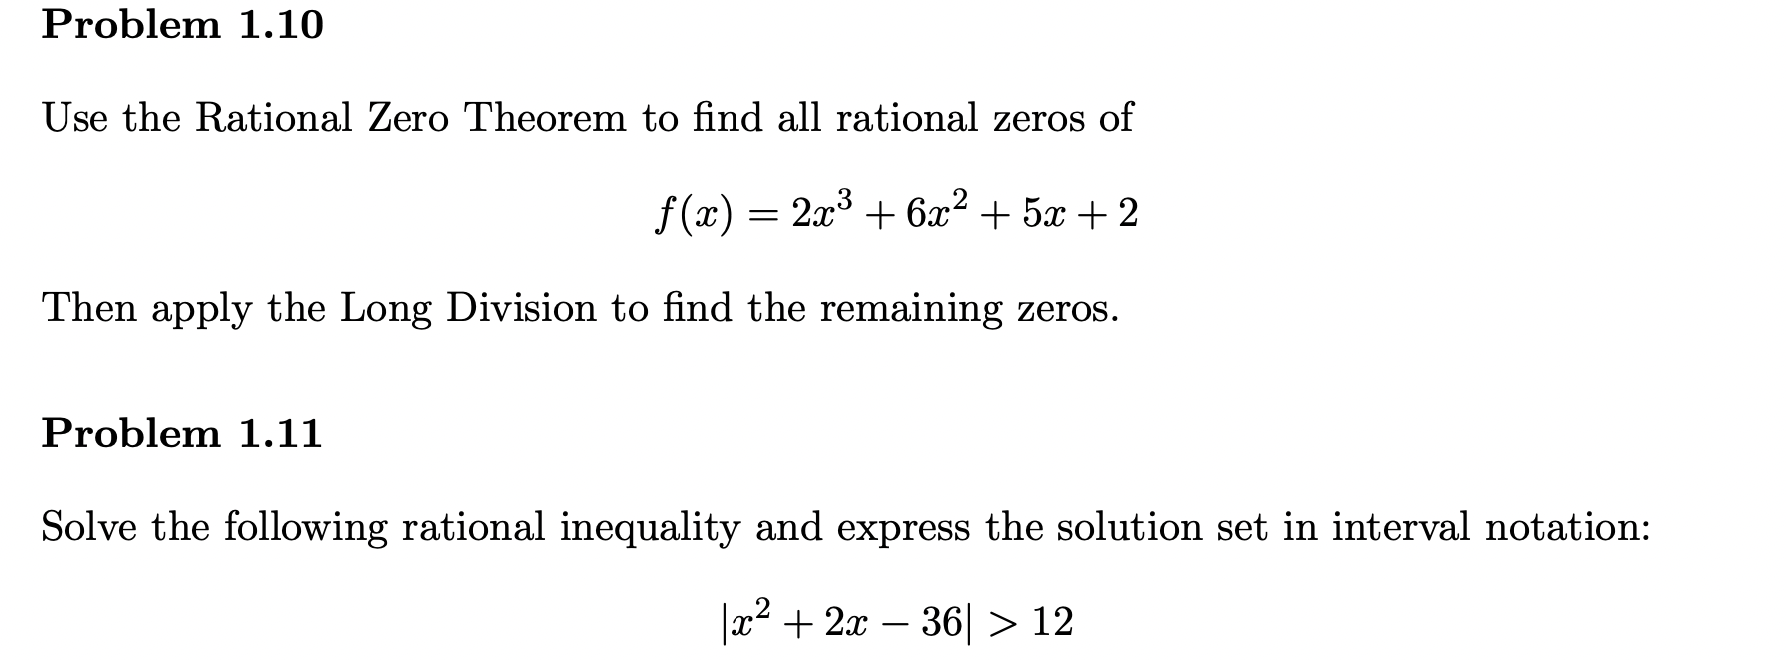
See the following graphs. The blue curve expresses the function y = f(x), while the red one represents y = g(x). Evaluate the following composite function values. 15 -4 - 3 -2 -1 0 3 2 -4 6 8- (a) (fog)(-1) (b) (fog) (1) (c) (go f) (0) (d) (go f) (-1)Problem 1.9 Dene the quadratic function at) 2 2x x2 2. (a) Find the vertex and ale-intercepts, yintercept (b) Sketch the graph of y = f (at) (c) Find the minimum or maximum value and determine Where it occurs. (d) Determine the function's domain and range. Problem 1.10 Use the Rational Zero Theorem to find all rational zeros of f(a) = 2x3 + 6x2 + 5x+2 Then apply the Long Division to find the remaining zeros. Problem 1.11 Solve the following rational inequality and express the solution set in interval notation: (x2 + 2x - 36 > 12
Step by Step Solution
There are 3 Steps involved in it

Get step-by-step solutions from verified subject matter experts