

Question: See the picture below: 1. We are using the number of passenger cars produced in the United States from 1999 through 2016 to fit different
See the picture below:
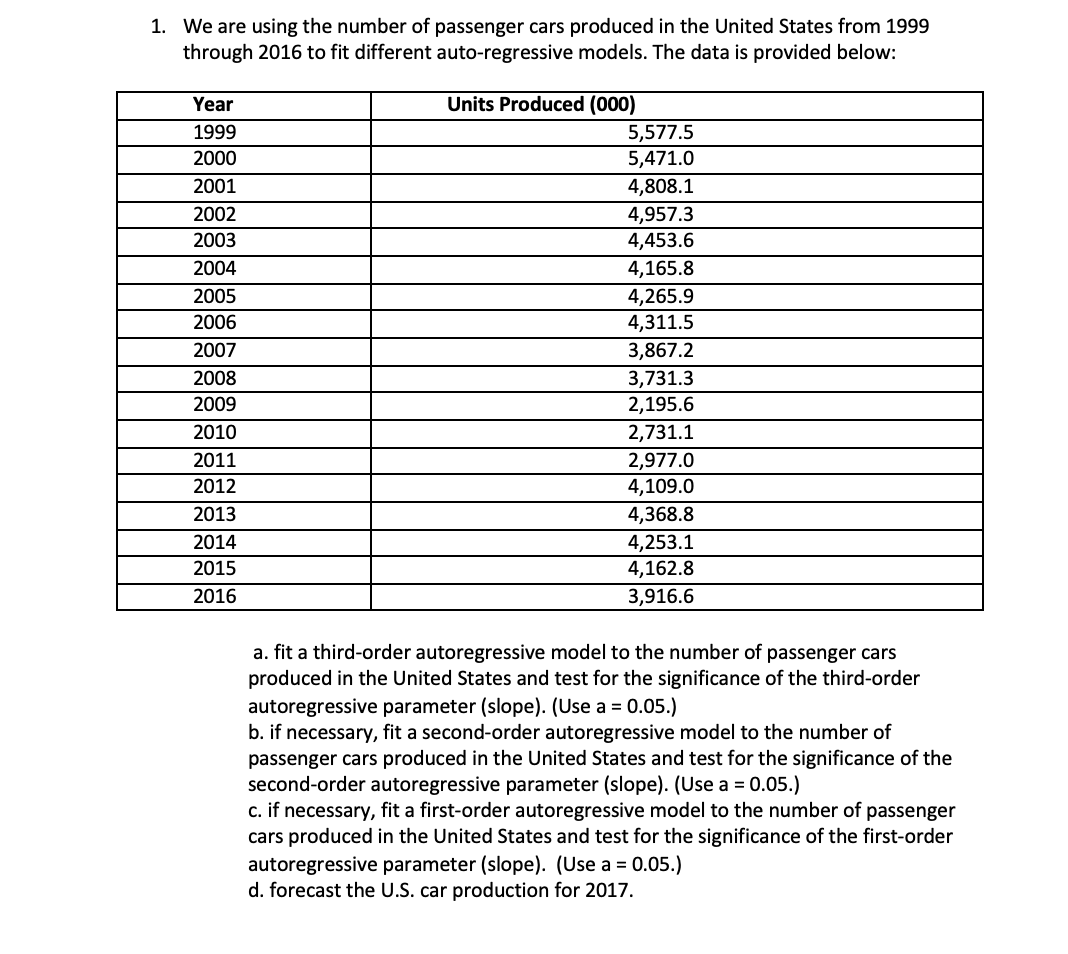
1. We are using the number of passenger cars produced in the United States from 1999 through 2016 to fit different auto-regressive models. The data is provided below: Year Units Produced (000) 1999 5,577.5 2000 5,471.0 2001 4,808.1 2002 4,957.3 2003 4,453.6 2004 4,165.8 2005 4,265.9 2006 4,311.5 2007 3,867.2 2008 3,731.3 2009 2,195.6 2010 2,731.1 2011 2,977.0 2012 4,109.0 2013 4,368.8 2014 4,253.1 2015 4,162.8 2016 3,916.6 a. fit a third-order autoregressive model to the number of passenger cars produced in the United States and test for the significance of the third-order autoregressive parameter (slope). (Use a = 0.05.) b. if necessary, fit a second-order autoregressive model to the number of passenger cars produced in the United States and test for the significance of the second-order autoregressive parameter (slope). (Use a = 0.05.) c. if necessary, fit a first-order autoregressive model to the number of passenger cars produced in the United States and test for the significance of the first-order autoregressive parameter (slope). (Use a = 0.05.) d. forecast the U.S. car production for 2017
Step by Step Solution
There are 3 Steps involved in it

Get step-by-step solutions from verified subject matter experts