

Question: See the table far below showing financial statement data and stock price data for Mydeco Corp. Complete the steps below using cell references to given
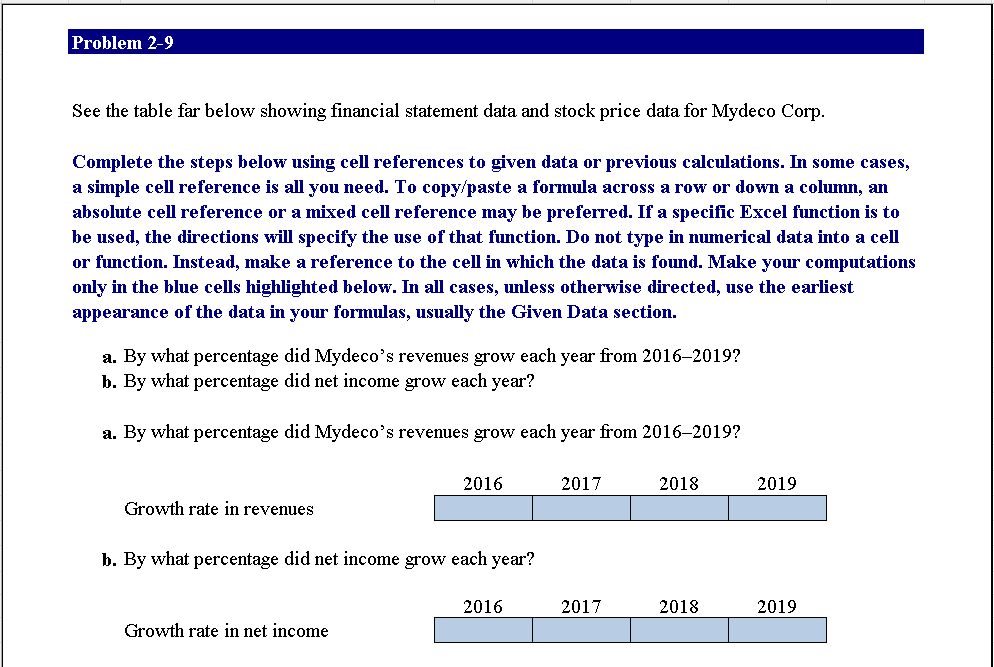
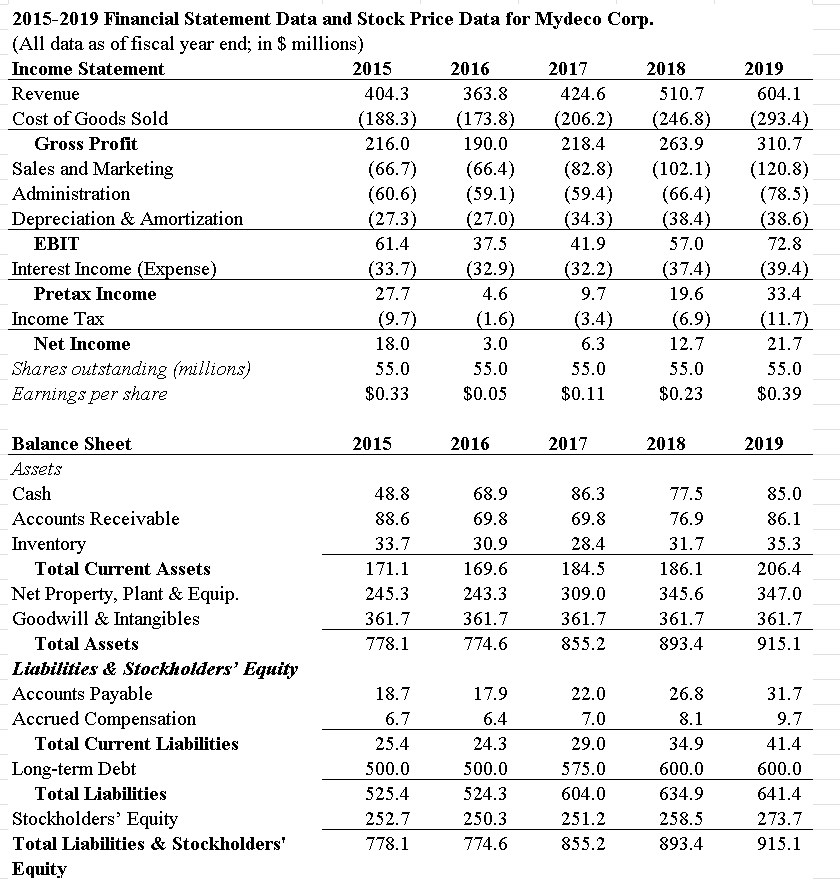
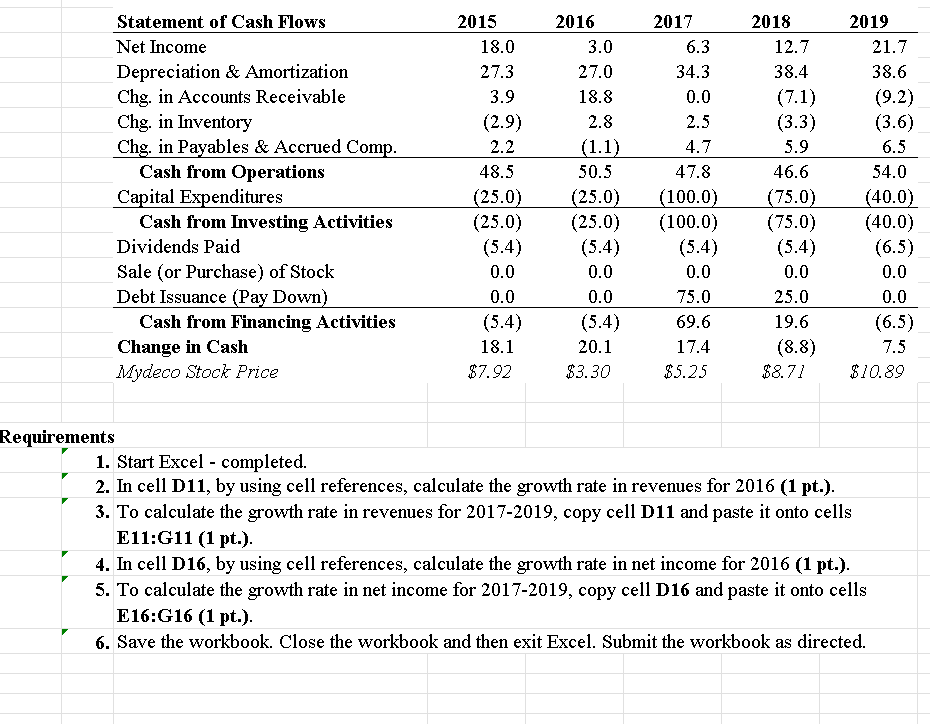
See the table far below showing financial statement data and stock price data for Mydeco Corp. Complete the steps below using cell references to given data or previous calculations. In some cases, a simple cell reference is all you need. To copy/paste a formula across a row or down a column, an absolute cell reference or a mixed cell reference may be preferred. If a specific Excel function is to be used, the directions will specify the use of that function. Do not type in numerical data into a cell or function. Instead, make a reference to the cell in which the data is found. Make your computations only in the blue cells highlighted below. In all cases, unless otherwise directed, use the earliest appearance of the data in your formulas, usually the Given Data section. a. By what percentage did Mydeco's revenues grow each year from 2016-2019? b. By what percentage did net income grow each year? a. By what percentage did Mydeco's revenues grow each year from 2016-2019? Growth rate in revenues b. By what percentage did net income grow each year? 1. Start Excel - completed. 2. In cell D11, by using cell references, calculate the growth rate in revenues for 2016 (1 pt.). 3. To calculate the growth rate in revenues for 20172019, copy cell D11 and paste it onto cells E11:G11 (1 pt.). 4. In cell D16, by using cell references, calculate the growth rate in net income for 2016 (1 pt.). 5. To calculate the growth rate in net income for 20172019, copy cell D16 and paste it onto cells E16:G16 (1 pt.). 6. Save the workbook. Close the workbook and then exit Excel. Submit the workbook as directed. 2015-2019 Financial Statement Data and Stock Price Data for Mydeco Corp. (All data as of fiscal year end; in $ millions)
Step by Step Solution
There are 3 Steps involved in it

Get step-by-step solutions from verified subject matter experts