

Question: Select a dataset with a variable you would like to forecast. You may use a different source other than the ones listed above (be sure
- Select a dataset with a variable you would like to forecast. You may use a different source other than the ones listed above (be sure to reference the website).
- State the variable you are forecasting.
- Select at least eight consecutive data values.
- Using the Time Series Forecasting Templates, determine the following for the selected variable:
- moving average,
- weighted moving average, and
- exponential smoothing (see the video in the Module 5 LiveBinder for additional information).
- the number of periods used in the moving average method.
- the weights used in the weighted moving average.
- the value of ? used in exponential smoothing.
- Provide a sentence that identifies the prediction.
- Circle, draw, etc. on the chart to indicate which value is the prediction for the next time period.
- Based on the MAD (mean absolute deviation) value, how would you prioritize the need to update the forecasting methods to improve overall predictions? Note: The higher the MAD value the worse the forecast.
- Indicate a rank of 1, 2, or 3 for each forecast with a 1 being the highest priority.
- Provide a brief recommendation to the company concerning the order in which the forecasts should be completed including why they are ranked in that order.
- Copy/paste the results of each method into your post. Be sure to state:
- Clearly indicate the "next period" prediction for each method.
- Choose one of the following:
- Suppose that the forecasting results are from three different branches of a company.
See guidance. to forecast time series data using a moving average, a weighted moving average, and exponential smoothing. You can also view a Competency Assessment starter video to assist you with the Module 5 Discussion Board in the Module 5 LiveBinder.
This is my answer below but I am not sure where I am going wrong with my written response. Can you review my answer and help me to fix it.
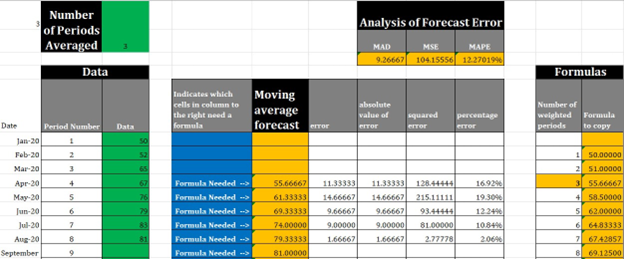
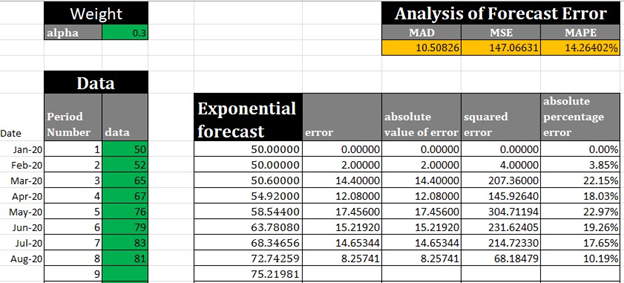
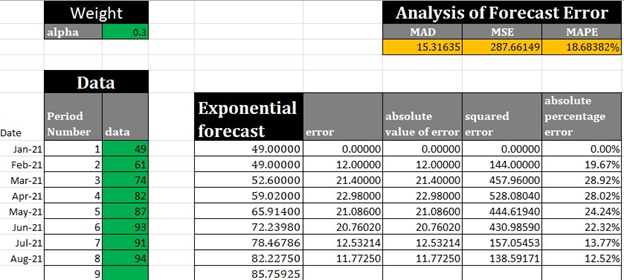
In the weighted moving average, I used the weight of 3. For the moving average, I used 3 periods for the calculations of the moving average method. For the exponential forecast, I used the value of 0.3. The next period in the next period in weighted moving average for 2020 is 81.5 and for 2021 it is 92.75. Next, the next period for the moving average for 2020 is 81 and for 2021 is 92.67. While the next period for the exponential forecast for 2020 is 75.21981 and for 2021 it is 85.75925. I have also highlighted in blue the next period for each prediction.
So, I would list the exponential forecast as a 1 in priority and then the moving average as 2nd in priority, and finally, the weighted moving average would be 3rd. I chose to rank them this way because this will allow the needs of the organization to be prioritized first either by using a more sophisticated model or updating the forecasting methods.
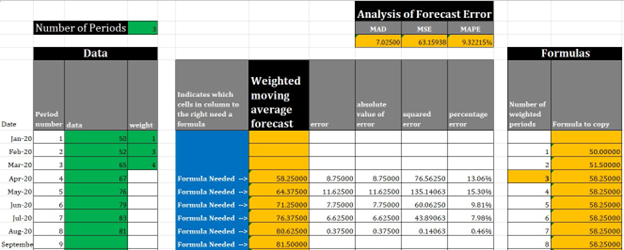


Period Date number data Jan-20 Feb-20 Mar-20 Apr-20 May-20 Jun-20 Jul-20 Number of Periods Data Aug-20 Septembe 1 2 3 4 5 6 7 6 9 50 52 65 67 76 79 83 81 weight Indicates which cells in column to the right need a formula Formula Needed --> Formula Needed -> Formula Needed -> Formula Needed -> Formula Needed -> Formula Needed -> Weighted moving average forecast error Analysis of Forecast Error MAD MSE MAPE 63.15938 9.32215% 7.02500 absolute value of error squared error 58.25000 8.75000 8.75000 76.56250 64.37500 11.62500 11.62500 135.14063 71.25000 7.75000 7.75000 60.06250 76.37500 6.62500 6.62500 43.89063 0.37500 0.14063 60.62500 0.37500 81.50000 percentage error 13.06% 15.304 9814 7.984 0.46% Formulas Number of weighted periods Formula to copy 1 2 3 4 5 6 7 8 50.00000 $1.50000 58.25000 58.25000 58.25000 58 25000 58.25000 58.25000
Step by Step Solution
3.32 Rating (161 Votes )
There are 3 Steps involved in it
Heres a breakdown of the strong points and areas for improvement Strengths Youve identified the data source and variable implicit in mentioning you di... View full answer

Get step-by-step solutions from verified subject matter experts