

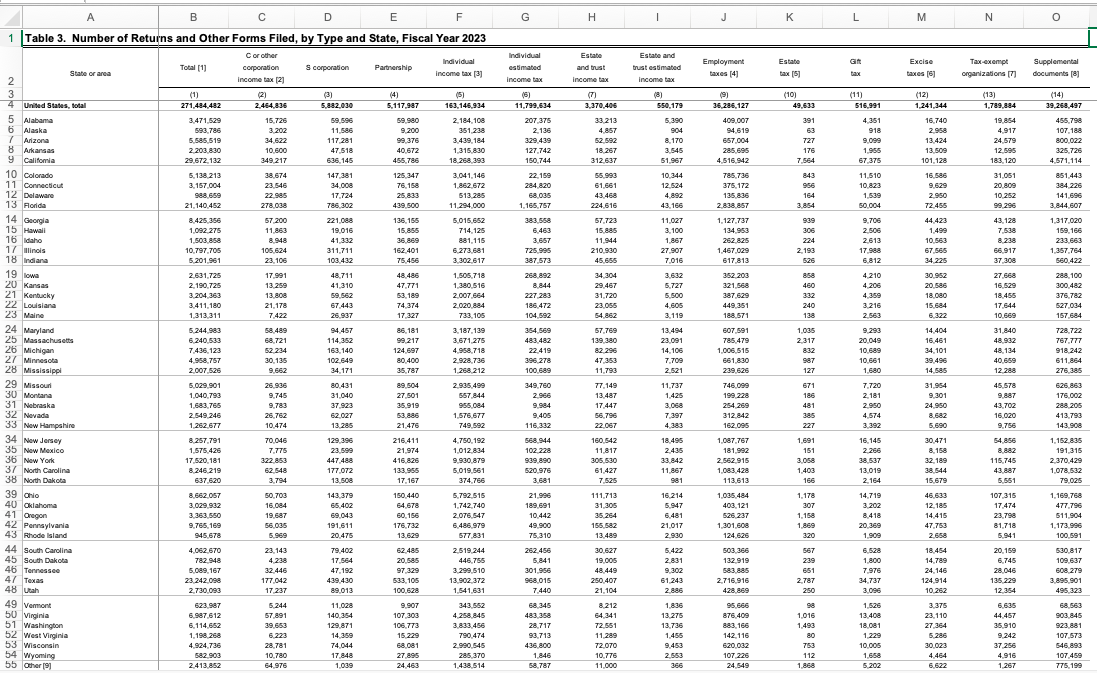
Question: Select an IRS Data Book Table ( Tables 3 , year 2 0 2 3 ) from the list below. Examine and make sense of
Select an IRS Data Book Table Tables year from the list below. Examine and make sense of the information. Choose the section of the data you want to concentrate on in order to use Excel to produce a graph or chart.
Compile the data under analysis into an Excel file.
Use information relevant to the message you wish to convey to make a chart or graph.
Explain what the graphed or plotted data indicates. What questions, for instance, does it address?
Step by Step Solution
There are 3 Steps involved in it
1 Expert Approved Answer
Step: 1 Unlock

Question Has Been Solved by an Expert!
Get step-by-step solutions from verified subject matter experts
Step: 2 Unlock
Step: 3 Unlock