

Question: Select one: can be used to study the relationship between two variables. O a. Cumulative Frequency Distribution Ob. Dot Plot O c. Frequency table
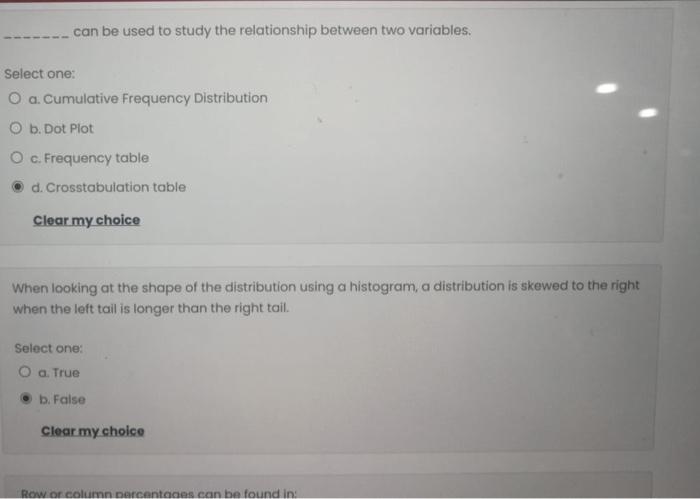
Select one: can be used to study the relationship between two variables. O a. Cumulative Frequency Distribution Ob. Dot Plot O c. Frequency table d. Crosstabulation table Clear my choice When looking at the shape of the distribution using a histogram, a distribution is skewed to the right when the left tail is longer than the right tail. Select one: O a. True b. False Clear my choice Row or column percentages can be found in:
Step by Step Solution
There are 3 Steps involved in it
1 Expert Approved Answer
Step: 1 Unlock

Question Has Been Solved by an Expert!
Get step-by-step solutions from verified subject matter experts
Step: 2 Unlock
Step: 3 Unlock