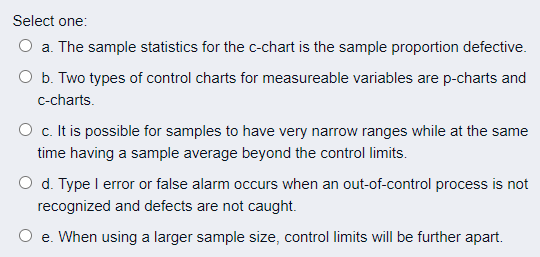
Question: Select one: O a. The sample statistics for the c-chart is the sample proportion defective. O b. Two types of control charts for measureable variables

Select one: O a. The sample statistics for the

Select one: O a. The sample statistics for the c-chart is the sample proportion defective. O b. Two types of control charts for measureable variables are p-charts and c-charts. O c. It is possible for samples to have very narrow ranges while at the same time having a sample average beyond the control limits. O d. Type I error or false alarm occurs when an out-of-control process is not recognized and defects are not caught. O e. When using a larger sample size, control limits will be further apart

Step by Step Solution

There are 3 Steps involved in it

1 Expert Approved Answer
Step: 1 Unlock blur-text-image
Question Has Been Solved by an Expert!

Get step-by-step solutions from verified subject matter experts

Step: 2 Unlock
Step: 3 Unlock

Students Have Also Explored These Related General Management Questions!