

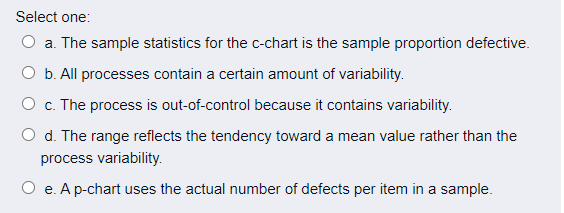
Question: Which options are true? Select one: O a. The sample statistics for the c-chart is the sample proportion defective. b. All processes contain a certain
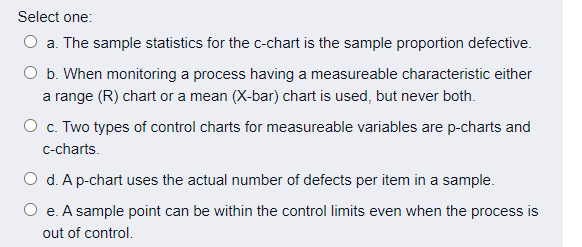
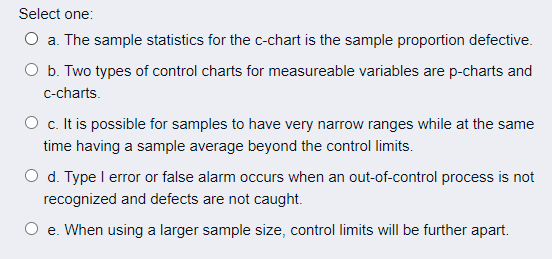
Which options are true?
Step by Step Solution
There are 3 Steps involved in it
1 Expert Approved Answer
Step: 1 Unlock

Question Has Been Solved by an Expert!
Get step-by-step solutions from verified subject matter experts
Step: 2 Unlock
Step: 3 Unlock