

Question: Select the best answer for the question. * E1 * Ez * Es A *EA * Es B 17. Consider the Venn diagram shown, which
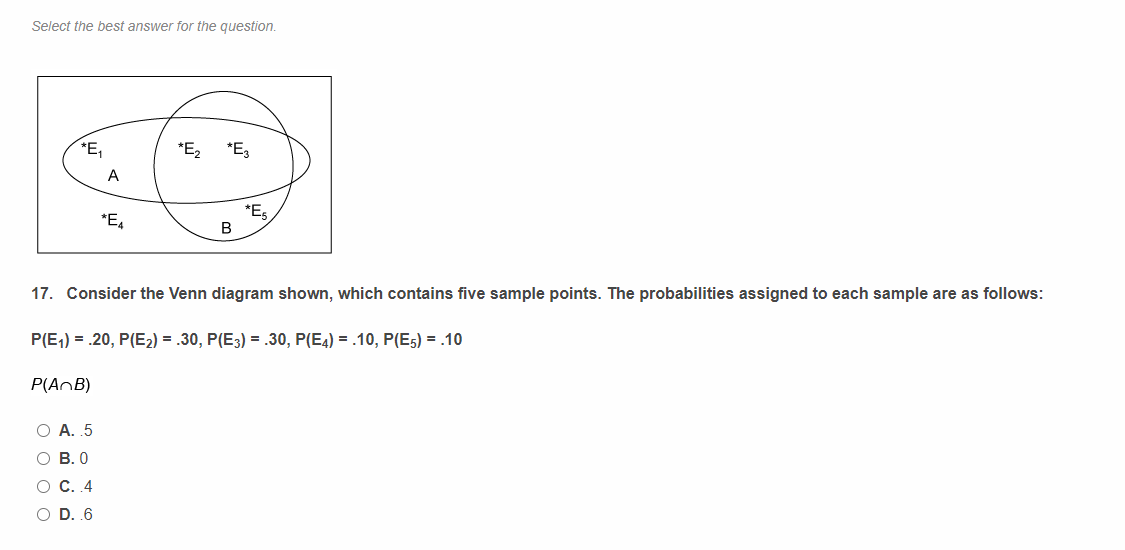
Select the best answer for the question. * E1 * Ez * Es A *EA * Es B 17. Consider the Venn diagram shown, which contains five sample points. The probabilities assigned to each sample are as follows: P(E1) = .20, P(E2) = .30, P(E3) = .30, P(E4) = .10, P(Es) = .10 P(AnB) O A. 5 O B. O O C. 4 O D. 6
Step by Step Solution
There are 3 Steps involved in it
1 Expert Approved Answer
Step: 1 Unlock

Question Has Been Solved by an Expert!
Get step-by-step solutions from verified subject matter experts
Step: 2 Unlock
Step: 3 Unlock