

Question: Select the graph that corresponds to a shift in the supply curve. fPrice S P1 P2 Quantity Q2 Q1Price P1 P2 D Quantity Q1 Q2Price
Select the graph that corresponds to a shift in the supply curve.
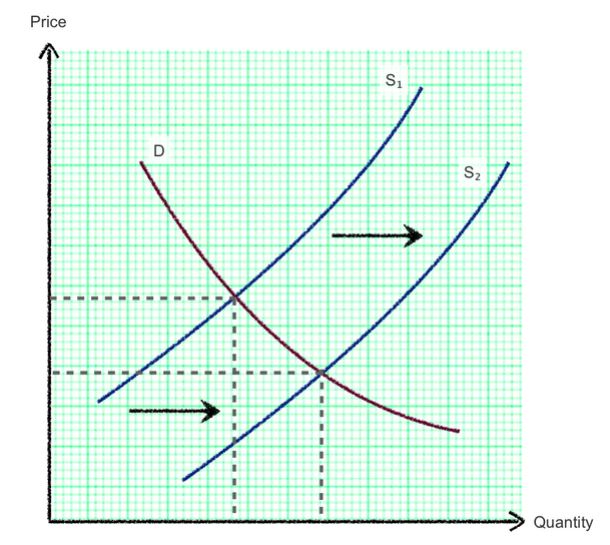
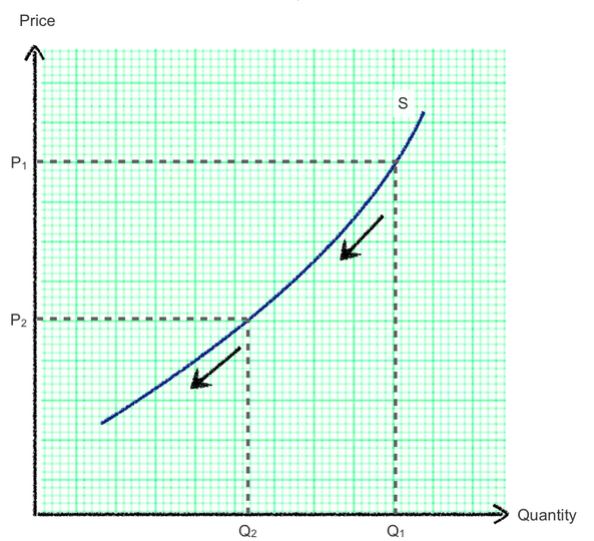
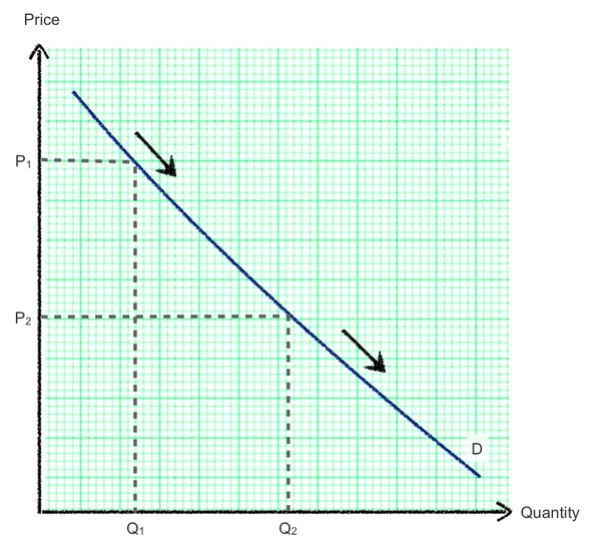
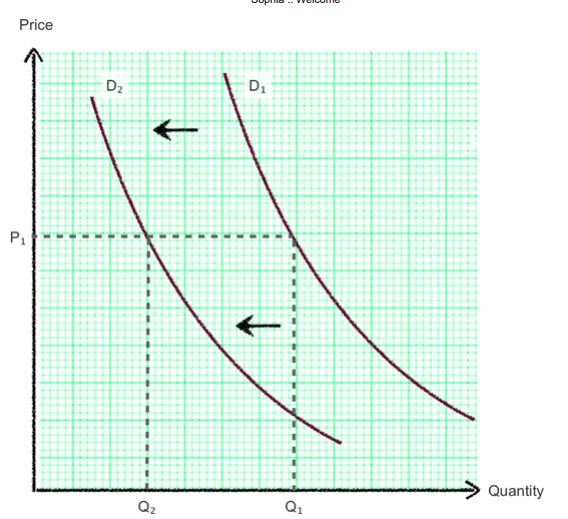
\fPrice S P1 P2 Quantity Q2 Q1Price P1 P2 D Quantity Q1 Q2Price D2 DI P1 Quantity Q2 Q1
Step by Step Solution
There are 3 Steps involved in it
1 Expert Approved Answer
Step: 1 Unlock

Question Has Been Solved by an Expert!
Get step-by-step solutions from verified subject matter experts
Step: 2 Unlock
Step: 3 Unlock