

Question: Select the scenario that best describes each graph shown on the right Each graph shows a different relationship between p and Q Graph a Choose

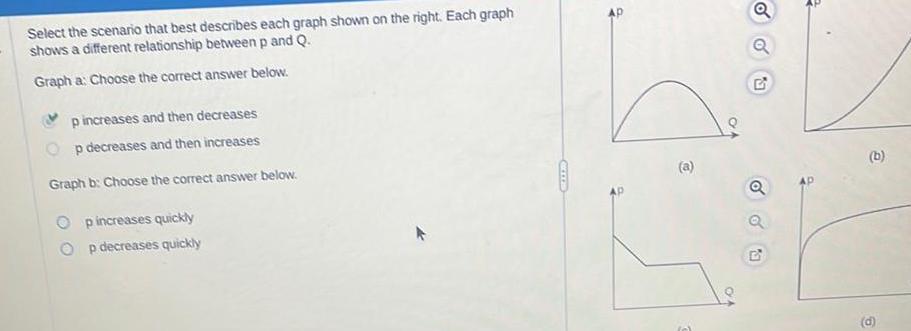
Select the scenario that best describes each graph shown on the right Each graph shows a different relationship between p and Q Graph a Choose the correct answer below p increases and then decreases p decreases and then increases Graph b Choose the correct answer below Op increases quickly p decreases quickly 9 a Q Q Q b d
Step by Step Solution
There are 3 Steps involved in it
1 Expert Approved Answer
Step: 1 Unlock

Question Has Been Solved by an Expert!
Get step-by-step solutions from verified subject matter experts
Step: 2 Unlock
Step: 3 Unlock